Thanks for the confirmation.
Yes, no issue then. It is a V1.1C module not affected by the errata.
Thanks for the confirmation.
Yes, no issue then. It is a V1.1C module not affected by the errata.
Let me confirm the basics.
Is it possible to connect USB to [X18 USB Debug Connector] of Dahlia board and connect an external debugger(For example Segger J-Link) to JTAG [X8] (JP6-OPEN) to debug Cortex-M4 programs?
@jorge.tx I think you tried this just yesterday, right? Can you confirm?
Hi, I am currently investigating this, but let me share my findings up until now:
It is possible to connect an external debugger to a Verdin Development Board and debug a Verdin iMX8MM, I have tested this by myself using a J-Link Segger
However, on Dahlia, I cannot get the output for the Core-M from the UART. I am using the code that changes it to UART_2, X19 14 and 15, but get no output. Connecting at the same time to X16 and X17 shows some corrupted output, so the signal is there, but there is something extra missing, which I am still investigating.
Sorry for the delay and I will contact you once I have any further information.
@jorge.tx
Thank you for sharing the information.
In my experiment, as shown in [デバッガ動作報告_240212_1.xlsx], when DebugUSB (Dahlia X18) is connected to the PC, J-Link Segger causes [起動エラー③]. If you do not connect to X18, you can connect to UART_2, X19 14 and 15 (X1 137/139) without any problems. My user’s purpose is to connect DebugUSB and communicate data with Cortex-M4 using X1 137/139.
The device tree has been changed so that UART2 can be used on the Cortex-M side.
&uart3 {
status = “disable”;
};
We look forward to seeing good results.
Yes, I have also observed this behaviour of output from X19 14 and 15 being cut once X18 is disconnected. However, if I then simply connect a JLINK Segger to X8, I get a corrupt output from reading UART_2.
I will keep you updated as soon as I find something.
@jorge.tx
Is there any progress on this matter?
I would like information to report to users.
I know you are busy, but thank you for your understanding.
Hi @katsu,
let me understand this correctly, as you said
My user’s purpose is to connect DebugUSB and communicate data with Cortex-M4 using X1 137/139.
Do you want to connect to JTAG and X18 at the same time?
This is something not allowed right now, as it can be see in the warnings on the JTAG page
@jorge.tx
Yes, I’m hoping to be able to connect an external debugger to JTAG (X8) and connect X18 (USB). The above explanation states that when JP6 is connected, it is not possible to connect at the same time, but we have determined that this can be handled by leaving JP6 unconnected (Open). Is my understanding different on this?
Yes, having JP6 open should be enough.
Right now, we are currently investigating this internally, but as JTAG is not something we usually check or get asked about, it is taking longer than expected. We are also seeing various results depending on the setup used for checking, which makes the investigation slower than usual.
Sorry for the inconvenience and I will contact you as soon as we find something.
@jorge.tx
Thank you for taking the time out of your busy schedule to investigate.
It seems that there are not many questions about JTAG, but how do other users debug Cortex-M4? Are you not using an external Debugger?
Similarly to Cortex-A, it is common to use the serial console and simply output the trace messages, specially if one is using an OS (ie. FreeRTOS). This removes the need of using external tools. That is one of the reasons we added the FTDI IC.
@alvaro.tx
Thank you for your reply.
I understand that the general method for debugging the Cortex-M side is to proceed while checking the status with PRINTF via X18 (USB).
Is this specific to Dahlia? Is this the general specification for the Toradex carrier board? Is it a specification specific to FreeRTOS?
This is Toradex approach, so it applies to Dahlia and the rest of the carrier boards. We specifically reserve a Cortex-M UART for Debug in our family definition for Verdin. Our FreeRTOS samples also use serial console as much as possible.
What does this answer mean?
Hi @katsu,
I was trying different approaches from my side and investigating the matter, hence Alvaro’s answer.
I have been facing some troubles, which included UART_2 debugger output suddenly disconnecting once a USB cable was plugged to X18, and was waiting until I found the root cause of the problems to give a straight answer.
Now, I have just discovered that my problems were with the cable/TTL converter I was using. Changing it to a new one now allows me to correctly see output from the JLINK Segger Debugger on UART_2, independent of any connection on X18. I have been debugging for a while with no problems on my side. It seems, in my case, it was due to a faulty cable.
As expected and as per the documentation, it is possible to use an external debugger while you have a cable attached to X18 as long as you have JP6 open. Could you please check the TTL converter or cable you are using to connect to UART_2? Also please make sure it is set to 1.8/1V8 and if possible, please try with another cable and see if you can still reproduce the issue.
@jorge.tx
Thank you for confirmation.
I’m a little confused.
@alvaro answered as follows:
This is Toradex approach, so it applies to Dahlia and the rest of the carrier boards. We specifically reserve a Cortex-M UART for Debug in our family definition for Verdin. Our FreeRTOS samples also use serial console as much as possible.
@jorge has the following answer
Now, I have just discovered that my problems were with the cable/TTL converter I was using. Changing it to a new one now allows me to correctly see output from the JLINK Segger Debugger on UART_2, independent of any connection on X18. I have been debugging for a while with no problems on my side. It seems, in my case, it was due to a faulty cable.
As expected and as per the documentation, it is possible to use an external debugger while you have a cable attached to X18 as long as you have JP6 open.
Aren’t the two answers contradictory?
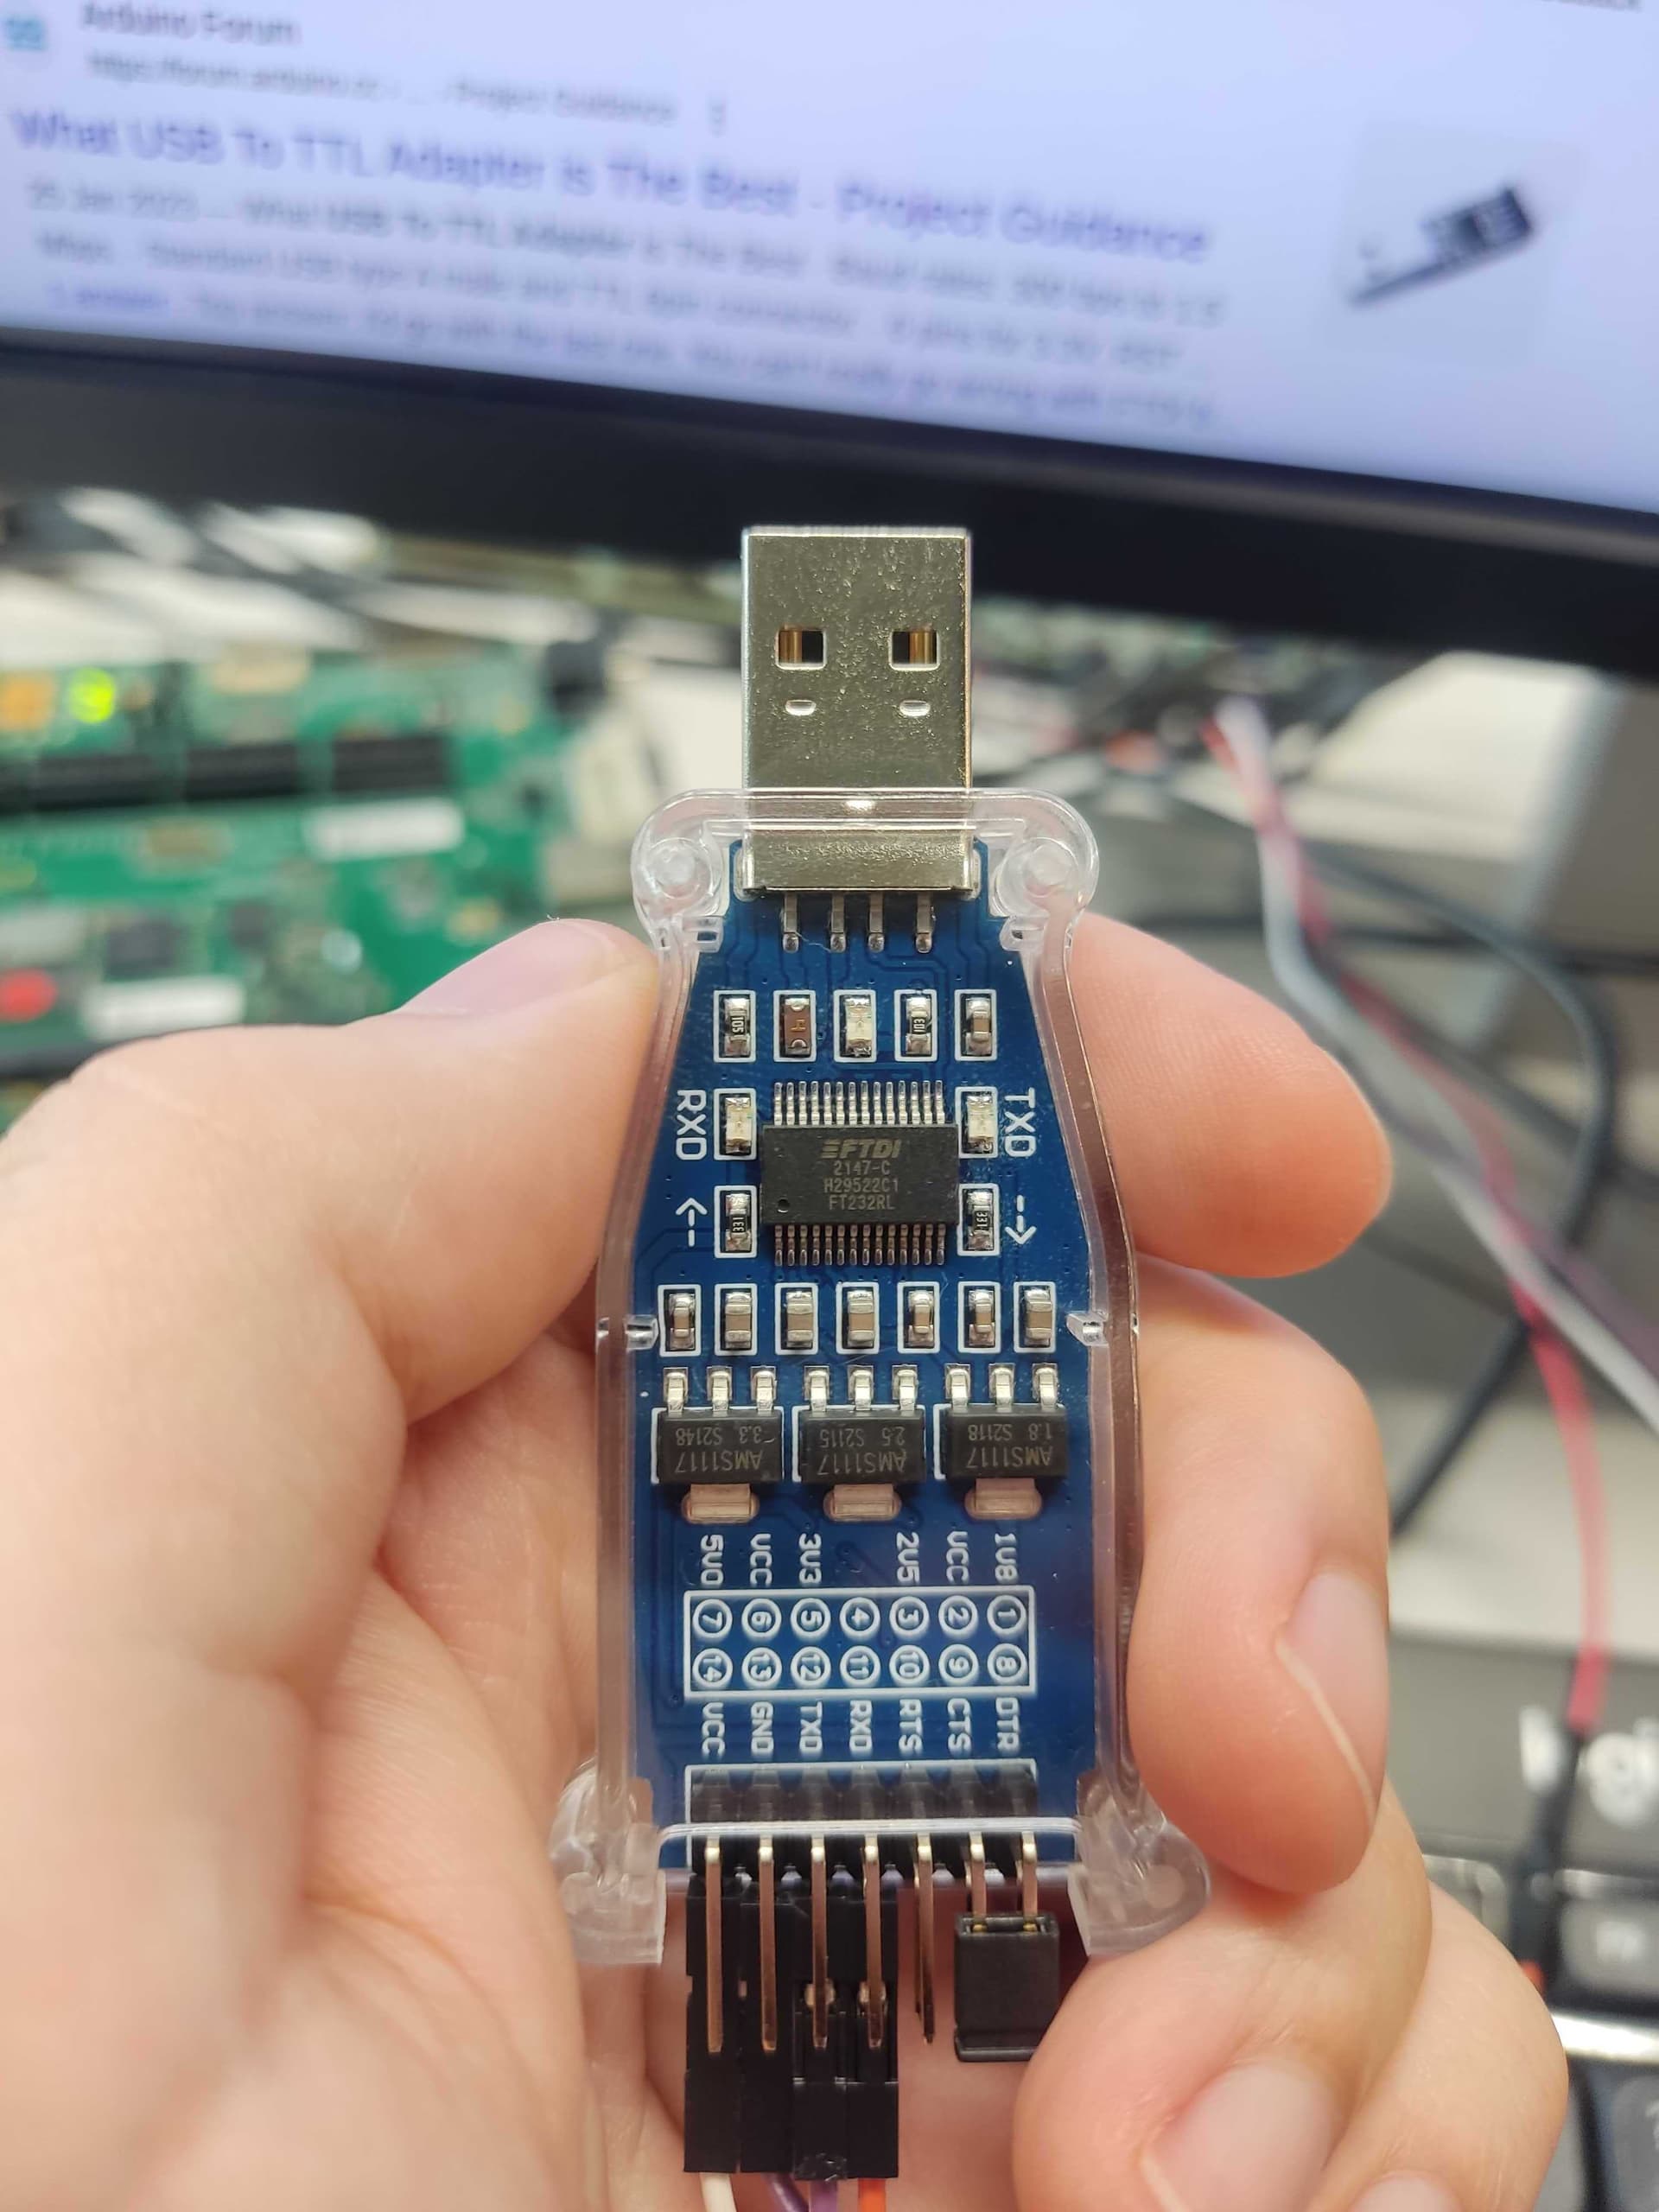
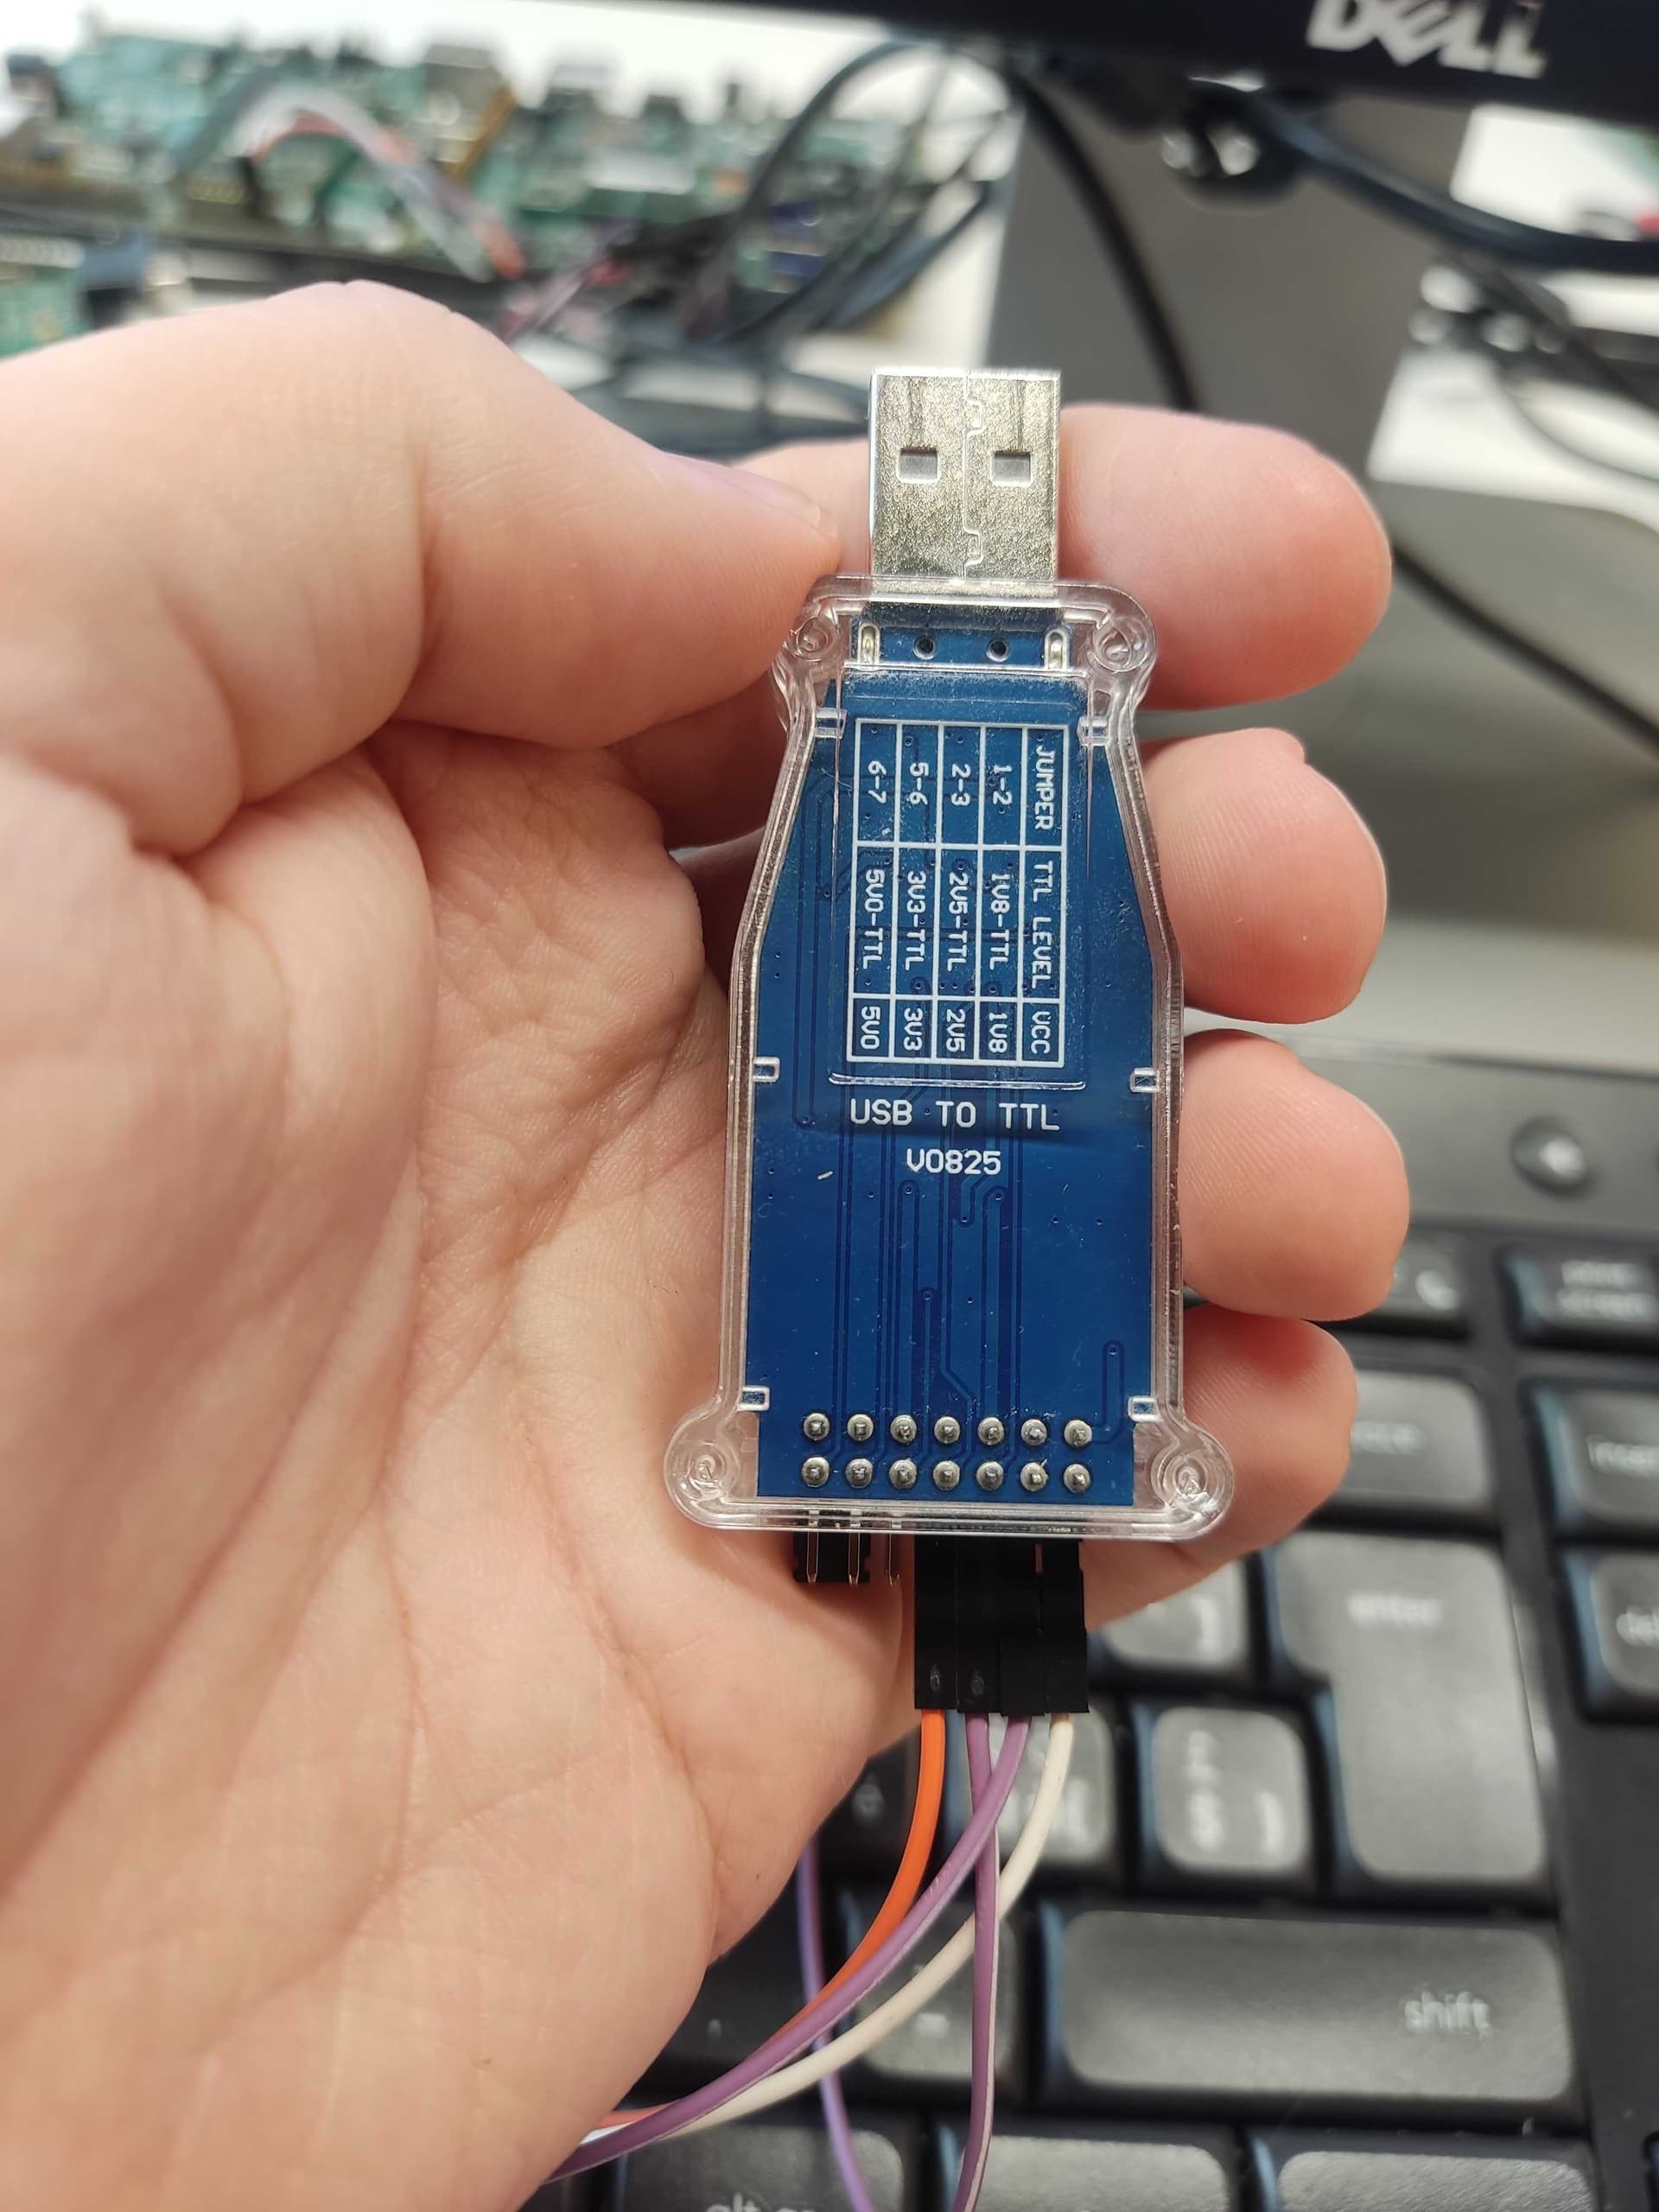
The cable and TTL converter connected to UART_2 (X19_14/15) are commercially available, and there is no problem with communication even if you connect JTAG-Debugger (Segger J-LINK). (Debugger doesn’t even start when I connect X18).
The USB to TTL adapter I am using is the following commercial product.
Model: SH-U09C3
Main chip: FTDI FT232RL
TTL level: 3.3V/5V
USB interface: 2.0
Also please make sure it is set to 1.8/1V8
Does this refer to TTL level?
Or is it JTAG input?
Please refer to [デバッガ動作報告_240212_1.xlsx] for my experimental results.
If you don’t mind, please tell me the part number of the USB-TTL converter you used.
Experiments with good results
Was the carrier board that connected X18, connected the terminal to UART_2 (X19 14/15), and debugged with JTAG-Debugger using Dahlia?
HI @katsu,
sorry for the confusion. I can see the output on UART_2 because I am using the modified code from this other thread.
This is an evolving topic so our information keeps getting updated.
Also, as far as I have tested as of today, debugging is allowed with a cable connected to X18 as long as you first start the debugger without it, and connect it afterwards.
It is indeed a very strange behaviour on a topic with not much information, but we are investigating it at the main office right now. As always, I will keep updating with test results and any new information we might have.
@jorge.tx
Thank you for your many experiments.
Write down the items to confirm.
Hi @katsu,
- “Also please make sure it is set to 1.8/1V8” is the output level of the USB-TTL converter?
Yes, as seen on the Dahlia Datasheet, its pins use 1.8V, so please make sure to set the output level accordingly (JTAG is also 1.8V).
- Does “debugging is allowed with a cable connected to X18 as long as you first start the debugger without it, and connect it afterwards.” mean connect to X18 later?
Yes, I have been able to debug correctly using the debugger if I:
1-> Disconnect X18
2-> Start the debugger
3->Reconnect X18
If you don’t mind, please tell me the part number of the USB-TTL converter you used.
It is a generic USB to TTL adapter with multiple level settings. Here are some pictures if you want them for reference: