I was able to set up the Torizon IDE Extension 2 (ApolloX) under Windows 11 (64) → WSL2.
A simple ‘HelloTorizon’ C console program works and I can debug it.
However, when I run my program on the module, I don’t get a terminal window, just the Debug Console, where the output only appears after the program exits.
Likewise: How can I pass values to the program via scanf during debug?
Just to clarify and make sure I understand your requests here. You’re asking for 2 separate things here.
Firstly, you want a terminal window to the device you’re debugging. Could you elaborate on this. What would be different for you between the debug console output and terminal output? Or is it just to be able to pass values to your program via console?
Secondly, you want to be able to pass input to your program to consume. Though I guess this is probably just related to the first point, yes? Basically you want to be able to type something on the VSCode side and send it to your application running on the remote device, did I understand that right?
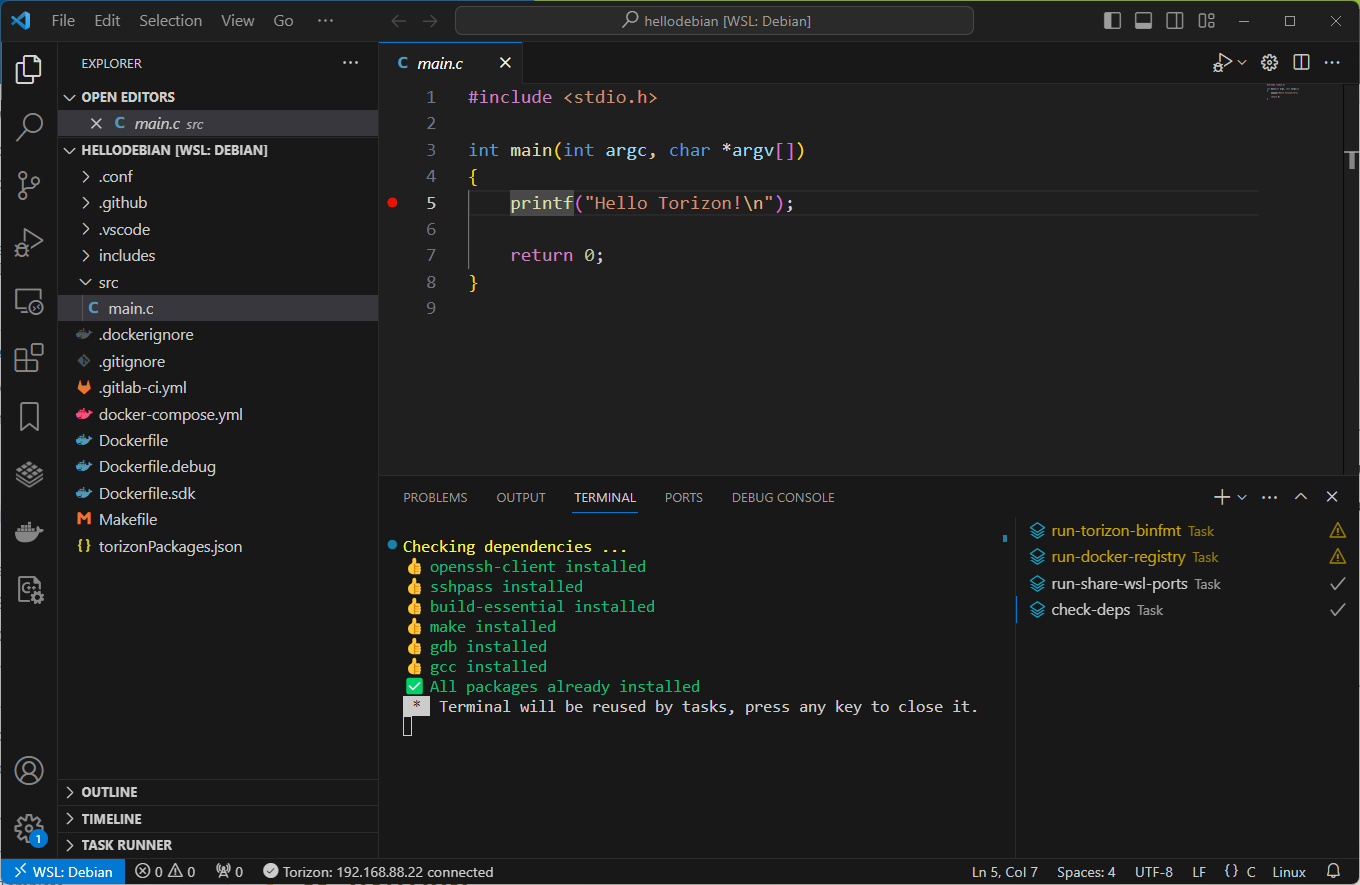
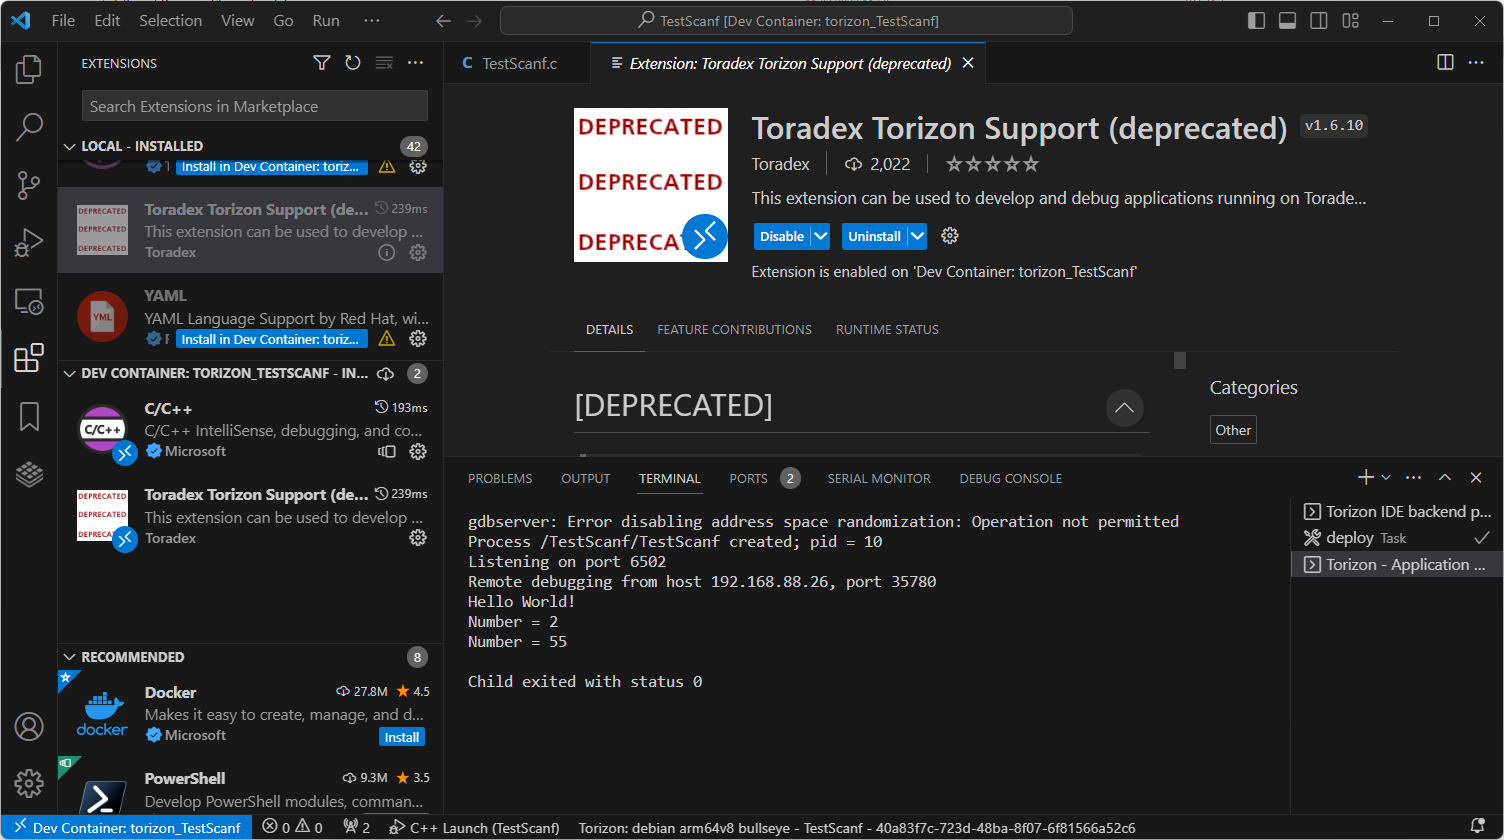
Please run the following code in ApolloX C Console Application to run it on a TorizonCore Module (for me: Apalis iMX8QM).
#include <stdio.h>
int main()
{
    int testInteger;
    printf("Enter an integer: ");
    scanf("%d", &testInteger);
    printf("Number = %d", testInteger);
    return 0;
}
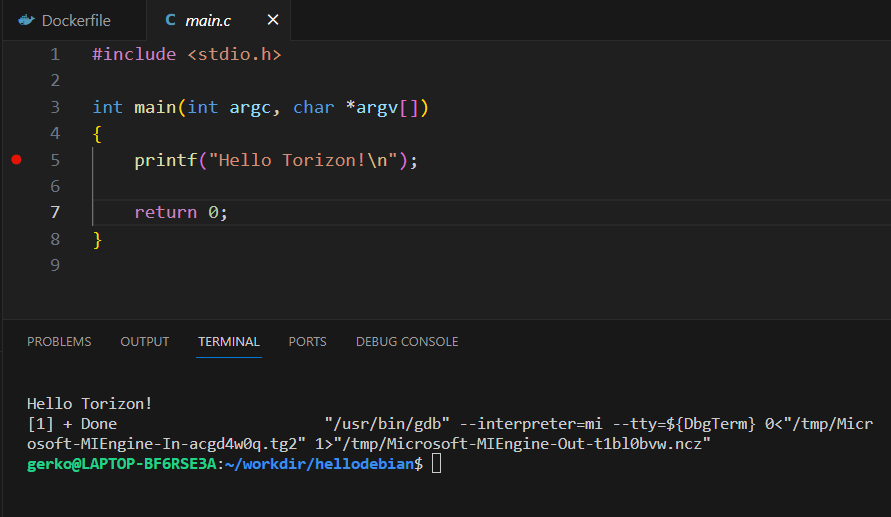
Select the ‘Local AMD64’ as the debug option and start debugging (F5 or press the green arrow)
For me, the integrated DEBUG CONSOLE becomes active and I can make an entry in a 2nd (VSCODE intern) TERMINAL Window.
All works fine …
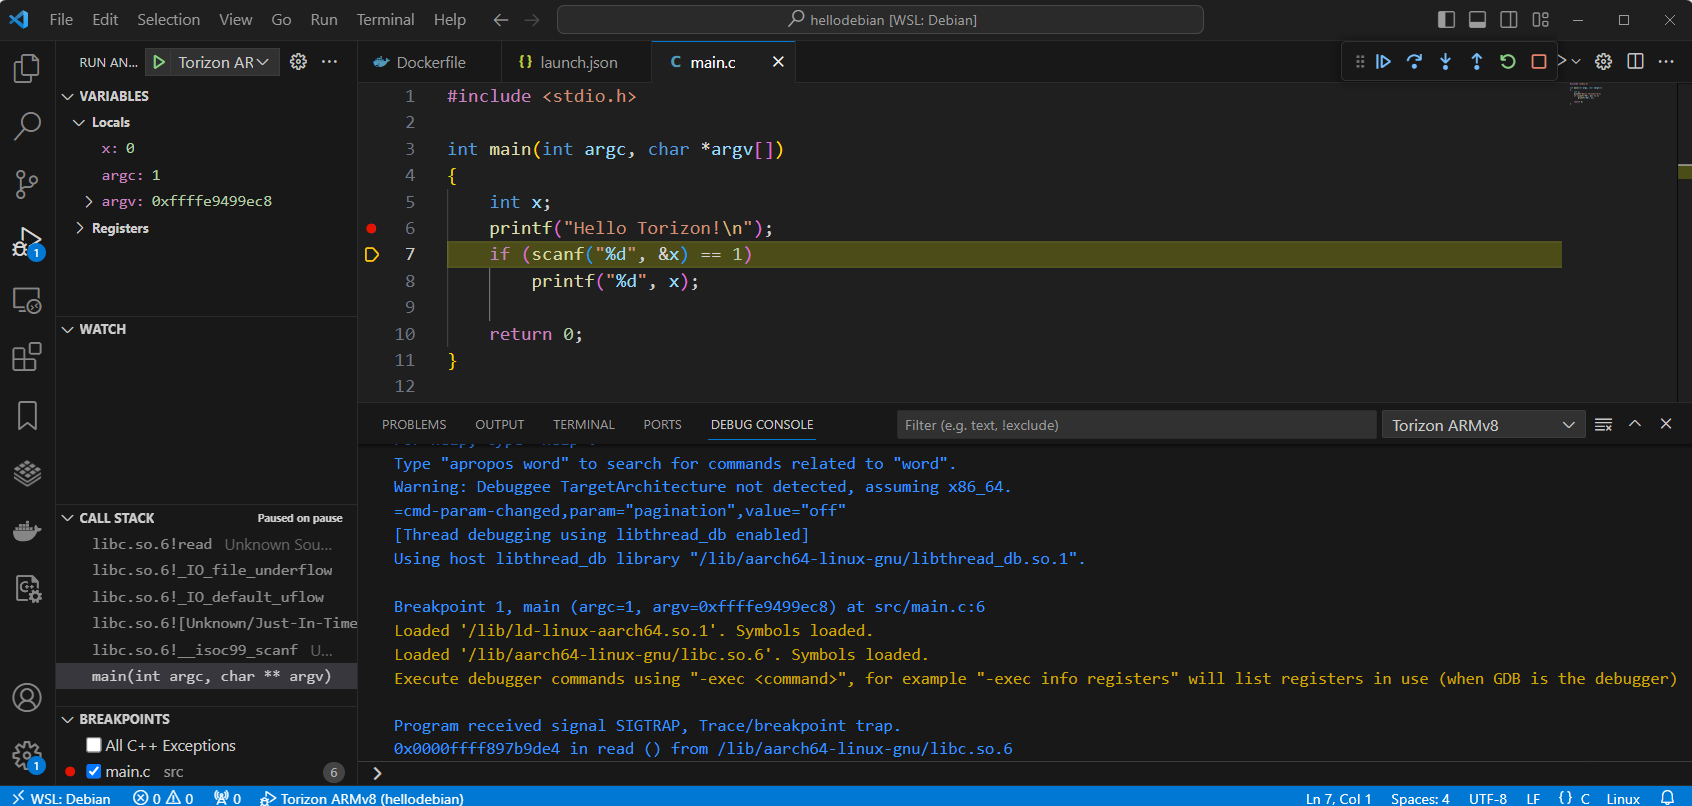
Now select “Torizon ARMv8” as debug option and start the debugging …
I do NOT get a terminal window.
The program is blocked at the scanf point. That’s it.
No output, no way to enter anything.
In this simple example I can debug the program in the ‘Local AMD64’ Debian WSL environment.
However, I would like to debug the program as it runs on the module with the desired devices (example: /dev/apalis-uart3 or /dev/apalis-spi2-cs0) as a console application (Torizon ARMv8).
Oh I think I understand your case now. Unfortunately as far as I know being able to access stdin of your application, such that things like scanf work is not currently possible. I believe it has to do with how VSCode handles remote debugging connections. This is why you didn’t see the issue when doing a local debug since the connection mechanism is different.
Let me check with our IDE extensions team and see if they have any ideas or recommendations here.
I think I partially understand the problem. However, in the Visual Studio Code Extension for Torizon for Windows [depricated] (not ApolloX) it worked.
There is probably a missing step in the signal chain from the container in the module through WSL-OS to Windows VSCode.
However, in the Visual Studio Code Extension for Torizon for Windows [depricated] (not ApolloX) it worked.
Are you sure about this? The original ticket we have internally regarding this limitation was created for the old now deprecated extension. As far as we know it should not have been possibly (by default) back then either. Did you do something non-standard perhaps to make it work before?
Hi @jeremias.tx ,
I tested it again straight away.
At least a separate terminal window opens. If you always add a ‘\n’ to the end of a printf, the output will appear in this window.
scanf(" %d", &testInteger); doesn’t work there either. but the variable can be edited in the debug controls and I can simulate a Input.
I had noticed that back then, but it had slipped my mind.
Ahh I see so scanf still didn’t work back then as I thought but you found a way to workaround it.
but the variable can be edited in the debug controls and I can simulate a Input.
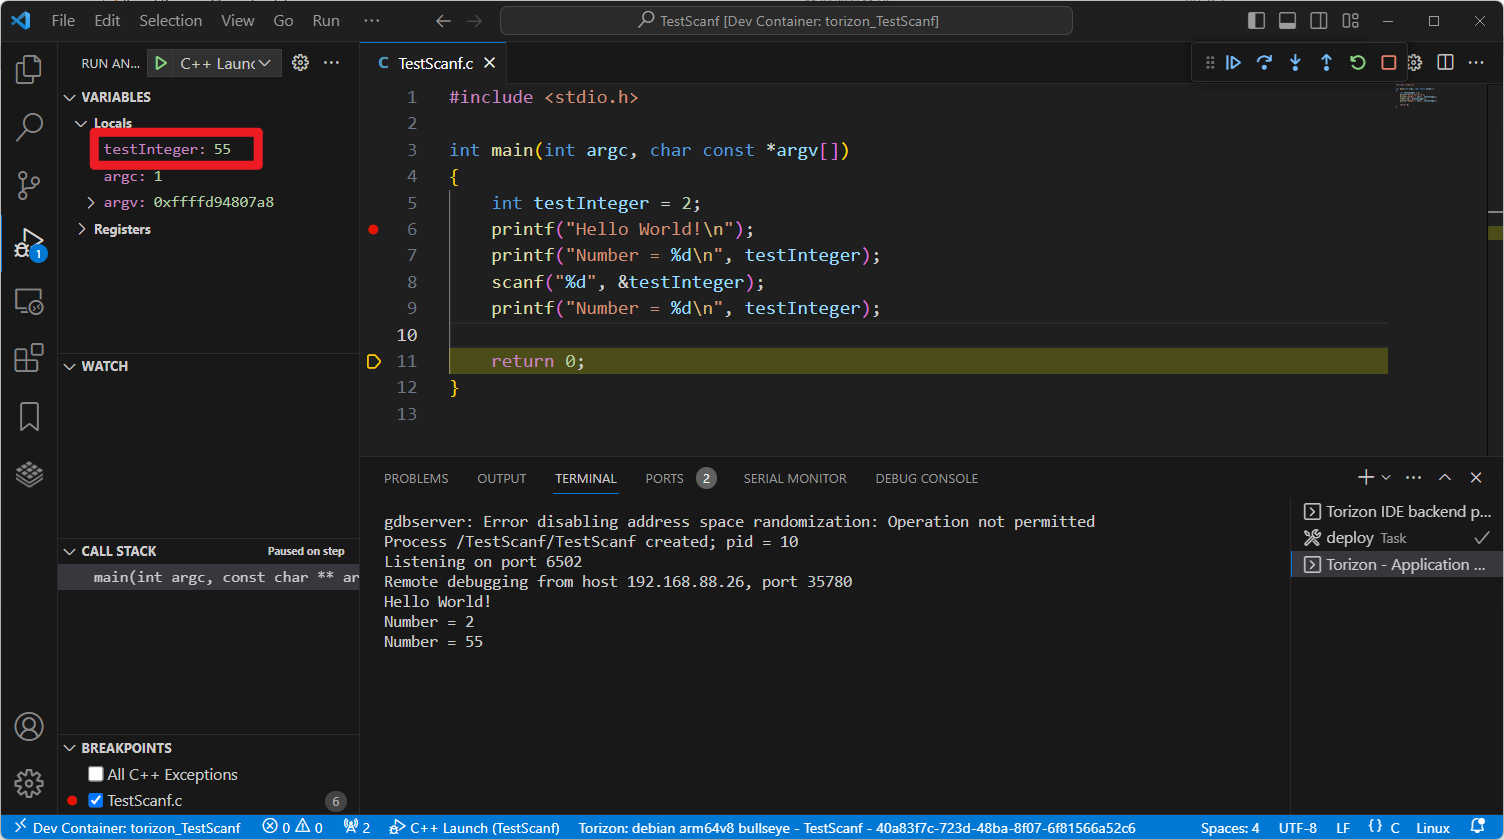
So I just tried this with ApolloX and I can still change the variable via the debug controls, but the debug process seems to get stuck on the scanf line and I can’t seem to make the debug progress past this point. In the old extension you’re saying it would progress past the scanf with your method?
As you may know ApolloX runs in WSL which is different than the previous extension which ran in Windows directly. Well as per the issue I linked it seems running in WSL doesn’t bring up a debug terminal/console, even when setting "externalConsole": true. Since we use the cppdbg tool for our debugging process we would be affected by this. It would also explain the difference you’re observing in ApolloX versus the previous extension.
Unfortunately, I’m not sure what the hopes are for this being fixed anytime soon. Seeing as the issue was opened in 2018 and there are still people in 2023 reporting about it.
Yes. It feels like there is always something in stdin, so you can simply jump over it using scanf() or getchar().
This allows you to debug the following code (you should set a brakepoint in the loop):
  while( c != 'x' )    // ascii dez 120
  {
    printf( "please ...:  " );
    fflush( stdout );
    c = getchar();

    printf( "you have entered ...: %c", c );
  }
In ApolloX the program behaves more ‘correctly’. You would just have to get something into the ‘stdin’. … Hmpf …
What are the plans for the old Torizon Core IDE for Windows? And how does it work in a Linux OS?
What are the plans for the old Torizon Core IDE for Windows?
This version of the IDE extension is currently in maintenance mode and will only have critical bug fixes if needed. Otherwise it will get no further updates or features. Once TorizonCore 5 is EOL this version of the extension will essentially become un-supported at that point.
And how does it work in a Linux OS?
As far as I know this terminal input doesn’t really work either on Linux. But in the end we’re limited by the capabilities of the cppdbg tool that we use since we’re not using our own custom-made debugging process here. Perhaps asking the maintainers of vscode-cpptools, would get you more information on the behavior of the debugger here.