JTAG Debug for Cortex-M

Dear Toradex Support,

I hope you are well. As I am experiencing an issue with my Verdin Imx8 Mini, I am reaching out to you for assistance. :slight_smile:

I successfully built an elf and binary file to toggle an LED.

When I tested the bin file by sending it to the var directory and loading and running the igpio_led_output.binary file into the Cortex-M with EXT4LOAD Loading Method, it worked fine and the led is blinking. :blush:

Now, I’m trying to replicate the same experiment using a JTAG debugger. Although the debugger can identify the core, I’m facing an issue. After loading[loadfile C:\Users\mehrdad.saei\Downloads\igpio_led_output.elf 0x0] the elf file and running the “g” command for run or the “h” command for halting, nothing happens with the LED.

Could you please assist me with this? I would greatly appreciate your help.

J-link commander V7.88K output:

J-Link>connect
Device "MIMX8MM6_M4" selected.


Connecting to target via JTAG
InitTarget() start
JTAG selected. Identifying JTAG Chain...
TotalIRLen = 4, IRPrint = 0x01
JTAG chain detection found 1 devices:
 #0 Id: 0x5BA00477, IRLen: 04, CoreSight JTAG-DP
JTAG Chain Identified. Connecting to DAP TAP...
Successfully connected to selected DAP TAP.
DAP initialized successfully.
InitTarget() end - Took 7.05ms
TotalIRLen = 4, IRPrint = 0x01
JTAG chain detection found 1 devices:
 #0 Id: 0x5BA00477, IRLen: 04, CoreSight JTAG-DP
DPv0 detected
AP map detection skipped. Manually configured AP map found.
AP[0]: MEM-AP (IDR: Not set)
AP[1]: MEM-AP (IDR: Not set)
AP[2]: MEM-AP (IDR: Not set)
AP[3]: MEM-AP (IDR: Not set)
AP[4]: AHB-AP (IDR: Not set)
AP[4]: Core found
AP[4]: AHB-AP ROM base: 0xE00FF000
CPUID register: 0x410FC241. Implementer code: 0x41 (ARM)
Found Cortex-M4 r0p1, Little endian.
FPUnit: 6 code (BP) slots and 2 literal slots
CoreSight components:
ROMTbl[0] @ E00FF000
[0][0]: E000E000 CID B105E00D PID 000BB00C SCS-M7
[0][1]: E0001000 CID B105E00D PID 003BB002 DWT
[0][2]: E0002000 CID B105E00D PID 002BB003 FPB
[0][3]: E0000000 CID B105E00D PID 003BB001 ITM
[0][5]: E0041000 CID B105900D PID 000BB925 ETM
[0][7]: E0043000 CID B105900D PID 001BB908 CSTF
[0][8]: E0044000 CID B105900D PID 004BB906 CTI
Memory zones:
  Zone: "Default" Description: Default access mode
Cortex-M4 identified.
J-Link>g
J-Link>connect
Device "MIMX8MM6_M4" selected.


Connecting to target via JTAG
InitTarget() start
JTAG selected. Identifying JTAG Chain...
TotalIRLen = 4, IRPrint = 0x01
JTAG chain detection found 1 devices:
 #0 Id: 0x5BA00477, IRLen: 04, CoreSight JTAG-DP
JTAG Chain Identified. Connecting to DAP TAP...
Successfully connected to selected DAP TAP.
DAP initialized successfully.
InitTarget() end - Took 10.9ms
TotalIRLen = 4, IRPrint = 0x01
JTAG chain detection found 1 devices:
 #0 Id: 0x5BA00477, IRLen: 04, CoreSight JTAG-DP
DPv0 detected
AP map detection skipped. Manually configured AP map found.
AP[0]: MEM-AP (IDR: Not set)
AP[1]: MEM-AP (IDR: Not set)
AP[2]: MEM-AP (IDR: Not set)
AP[3]: MEM-AP (IDR: Not set)
AP[4]: AHB-AP (IDR: Not set)
AP[4]: Core found
AP[4]: AHB-AP ROM base: 0xE00FF000
CPUID register: 0x410FC241. Implementer code: 0x41 (ARM)
Found Cortex-M4 r0p1, Little endian.
FPUnit: 6 code (BP) slots and 2 literal slots
CoreSight components:
ROMTbl[0] @ E00FF000
[0][0]: E000E000 CID B105E00D PID 000BB00C SCS-M7
[0][1]: E0001000 CID B105E00D PID 003BB002 DWT
[0][2]: E0002000 CID B105E00D PID 002BB003 FPB
[0][3]: E0000000 CID B105E00D PID 003BB001 ITM
[0][5]: E0041000 CID B105900D PID 000BB925 ETM
[0][7]: E0043000 CID B105900D PID 001BB908 CSTF
[0][8]: E0044000 CID B105900D PID 004BB906 CTI
Memory zones:
  Zone: "Default" Description: Default access mode
Cortex-M4 identified.
J-Link>loadfile C:\Users\mehrdad.saei\Downloads\igpio_led_output.elf 0x0
'loadfile': Performing implicit reset & halt of MCU.
ResetTarget() start
ResetTarget() end - Took 2us
Downloading file [C:\Users\mehrdad.saei\Downloads\igpio_led_output.elf]...
O.K.
J-Link>connect
>Device "MIMX8MM6_M4" selected.


Connecting to target via JTAG
InitTarget() start
JTAG selected. Identifying JTAG Chain...
TotalIRLen = 4, IRPrint = 0x01
JTAG chain detection found 1 devices:
 #0 Id: 0x5BA00477, IRLen: 04, CoreSight JTAG-DP
JTAG Chain Identified. Connecting to DAP TAP...
Successfully connected to selected DAP TAP.
DAP initialized successfully.
InitTarget() end - Took 10.3ms
TotalIRLen = 4, IRPrint = 0x01
JTAG chain detection found 1 devices:
 #0 Id: 0x5BA00477, IRLen: 04, CoreSight JTAG-DP
DPv0 detected
AP map detection skipped. Manually configured AP map found.
AP[0]: MEM-AP (IDR: Not set)
AP[1]: MEM-AP (IDR: Not set)
AP[2]: MEM-AP (IDR: Not set)
AP[3]: MEM-AP (IDR: Not set)
AP[4]: AHB-AP (IDR: Not set)
AP[4]: Core found
AP[4]: AHB-AP ROM base: 0xE00FF000
CPUID register: 0x410FC241. Implementer code: 0x41 (ARM)
Found Cortex-M4 r0p1, Little endian.
FPUnit: 6 code (BP) slots and 2 literal slots
CoreSight components:
ROMTbl[0] @ E00FF000
[0][0]: E000E000 CID B105E00D PID 000BB00C SCS-M7
[0][1]: E0001000 CID B105E00D PID 003BB002 DWT
[0][2]: E0002000 CID B105E00D PID 002BB003 FPB
[0][3]: E0000000 CID B105E00D PID 003BB001 ITM
[0][5]: E0041000 CID B105900D PID 000BB925 ETM
[0][7]: E0043000 CID B105900D PID 001BB908 CSTF
[0][8]: E0044000 CID B105900D PID 004BB906 CTI
Memory zones:
  Zone: "Default" Description: Default access mode
Cortex-M4 identified.
J-Link>r
Reset delay: 0 ms
Reset type NORMAL: Resets core & peripherals via SYSRESETREQ & VECTRESET bit.
ResetTarget() start
ResetTarget() end - Took 2us
J-Link>g
J-Link>h
PC = 1FFE0008, CycleCnt = 1DD42C6B
R0 = 00000000, R1 = 00000000, R2 = 00000000, R3 = 00000000
R4 = 00000000, R5 = 00000000, R6 = 00000000, R7 = 00000000
R8 = 00000000, R9 = 00000000, R10= 00000000, R11= 00000000
R12= 00000000
SP(R13)= 20008000, MSP= 20008000, PSP= 00000000, R14(LR) = FFFFFFFF
XPSR = 01000000: APSR = nzcvq, EPSR = 01000000, IPSR = 000 (NoException)
CFBP = 00000000, CONTROL = 00, FAULTMASK = 00, BASEPRI = 00, PRIMASK = 00

FPS0 = 00000000, FPS1 = 00000000, FPS2 = 00000000, FPS3 = 00000000
FPS4 = 00000000, FPS5 = 00000000, FPS6 = 00000000, FPS7 = 00000000
FPS8 = 00000000, FPS9 = 00000000, FPS10= 00000000, FPS11= 00000000
FPS12= 00000000, FPS13= 00000000, FPS14= 00000000, FPS15= 00000000
FPS16= 00000000, FPS17= 00000000, FPS18= 00000000, FPS19= 00000000
FPS20= 00000000, FPS21= 00000000, FPS22= 00000000, FPS23= 00000000
FPS24= 00000000, FPS25= 00000000, FPS26= 00000000, FPS27= 00000000
FPS28= 00000000, FPS29= 00000000, FPS30= 00000000, FPS31= 00000000
FPSCR= 00000000
J-Link>

igpio_led_output.bin (15.4 KB)
igpio_led_output.elf (262.5 KB)

Best regards,
Mehrdad
Hello @Mehrdad,

Thanks for reaching out!
Have you already taken a look at this document:

Hi @rudhi.tx ,

Thank you so much for your response.

Yes, I saw that, but I prefer using the J-link commander instead of Ubuntu.

It cannot recognize the debugger after installing the drivers, and I prefer to use the Jlink software directly.

Best regards,
Mehrdad

Hi @rudhi.tx,

When I use Ubuntu 22.04, nothing happens and it is not connected to the Jlink debugger.
The debugger’s led remains red.
On the Verdin development board, I connected the debugger to pin header X67.
my debugger is Segger basic j-link and it supports imx8 mini, I have imx8 mini with TorizonCore 6

MCUXpresso SDK:
SDK_2.13.0_MIMX8MM6xxxKZ

The GCC Toolchain:

x86_64 Linux hosted cross toolchains
AArch32 bare-metal target (arm-none-eabi)

arm-gnu-toolchain-12.2.MPACBTI-Rel1-x86_64-arm-none-eabi.tar.xz

The output of Ubuntu:

mehrdad@LAPTOP-DHGJM4R6:~$ JLinkGDBServer -if JTAG -device MIMX8MM6_M4
SEGGER J-Link GDB Server V7.70c Command Line Version

JLinkARM.dll V7.70c (DLL compiled Aug 18 2022 17:29:50)

Command line: -if JTAG -device MIMX8MM6_M4
-----GDB Server start settings-----
GDBInit file:                  none
GDB Server Listening port:     2331
SWO raw output listening port: 2332
Terminal I/O port:             2333
Accept remote connection:      yes
Generate logfile:              off
Verify download:               off
Init regs on start:            off
Silent mode:                   off
Single run mode:               off
Target connection timeout:     0 ms
------J-Link related settings------
J-Link Host interface:         USB
J-Link script:                 none
J-Link settings file:          none
------Target related settings------
Target device:                 MIMX8MM6_M4
Target device parameters:      none
Target interface:              JTAG
Target interface speed:        4000kHz
Target endian:                 little

Connecting to J-Link...
JLinkGUIServerExe: cannot connect to X server
Connecting to J-Link failed. Connected correctly?
GDBServer will be closed...
Shutting down...
Could not connect to J-Link.
Please check power, connection and settings.

I also shared these details with Segger experts, who told me:

According to the J-Link Commander output, not even the connect works as expected.

The iMX8 is a quite complex device where usually a Linux is booted. From similar cases

in the past, I can tell you that in >90 % of such cases, the Linux was identified by the

user as root cause. Usually the it disables debug pins / debug clocks / debug unit / etc…

If this is the case, the output looks similar to the one shared with us.

Please understand that we cannot see any problems on J-Link side here.

I am pretty sure that the root cause of the failed connect is no misbehavior

of the J-Link but the current state of the MCU (debug connection not possible).

Best regards,
Mehrdad

Hello @Mehrdad,

We are investigating this internally and I will come back to you as soon as I have some news.
Thanks for understanding!

1 Like

Hi @rudhi.tx ,

I really appreciate your help and in the meantime, if I find anything I will share it.

Best regards,
Mehrdad

Hello @Mehrdad,

Thanks for your patience.
Could you please try with the JLinkGDBServer or JLinkGDBServerExe and not the JLinkGDBServerCLExe and let me know how that goes?

Also, could you please share the sources of the gpioled project that you are running?

Hi @rudhi.tx,

Thank you so much for your time,
I have not tried JLinkGDBServerCLExe.

As you can see here I used JLinkGDBServer and if I used JLinkGDBServerExe it says:

mehrdad@LAPTOP-DHGJM4R6:~$ JLinkGDBServerExe -if JTAG -device MIMX8MM6_M4
JLinkGDBServerExe: cannot connect to X server

For gpioled I used the SDK’s example from:
\cortex-m\boards\evkmimx8mm\driver_examples\gpio\led_output

Also, I have tried hello_world from:
\cortex-m\boards\evkmimx8mm\demo_apps\hello_world

Best regards,
Mehrdad

Hi @Mehrdad,

May I ask what type of cable you are using to connect to the J-Link debugger?
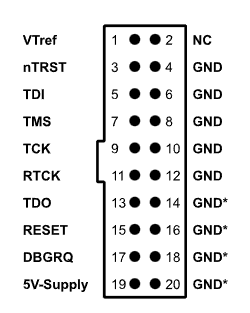
For your reference, please take a look into the JTAG Interface Connection here:
image
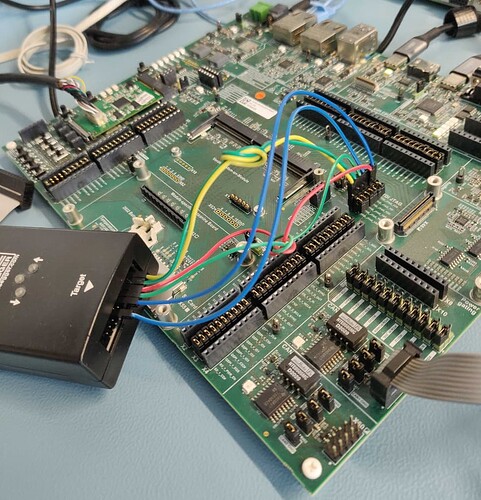
I was able to get the debugging working properly after I connected the cables correctly. Here is my setup:

Hi @rudhi.tx
Thank you for sharing that information and for taking the time to help. I am using the same jumpers and the same pin-header (X67)as you, but my debugger is more basic. However, it does support imx8 mini. Could you kindly share your Ubuntu configuration, please?
best regards,
Mehrdad

Hello @Mehrdad,

Thanks for the feedback. This looks like the GDB Server is attempting to open the GUI and somehow is not able to. Could you please try the following command:
JLinkGDBServer -if JTAG -device MIMX8MM6_M4 -NoGui

Could you kindly share your Ubuntu configuration, please?

Here is my Ubuntu Configuration:

NAME="Ubuntu"
VERSION="20.04.6 LTS (Focal Fossa)"
ID=ubuntu
ID_LIKE=debian
PRETTY_NAME="Ubuntu 20.04.6 LTS"
VERSION_ID="20.04"
HOME_URL="https://www.ubuntu.com/"
SUPPORT_URL="https://help.ubuntu.com/"
BUG_REPORT_URL="https://bugs.launchpad.net/ubuntu/"
PRIVACY_POLICY_URL="https://www.ubuntu.com/legal/terms-and-policies/privacy-policy"
VERSION_CODENAME=focal
UBUNTU_CODENAME=focal

Hi @rudhi.tx ,
Thank you so much for your time, I really appreciate it.

mehrdad@LAPTOP-DHGJM4R6:~$ cat /etc/os-release
PRETTY_NAME=“Ubuntu 22.04.2 LTS”
NAME=“Ubuntu”
VERSION_ID=“22.04”
VERSION=“22.04.2 LTS (Jammy Jellyfish)”
VERSION_CODENAME=jammy
ID=ubuntu
ID_LIKE=debian
HOME_URL=“https://www.ubuntu.com/
SUPPORT_URL=“https://help.ubuntu.com/
BUG_REPORT_URL=“https://bugs.launchpad.net/ubuntu/
PRIVACY_POLICY_URL=“Data privacy | Ubuntu
UBUNTU_CODENAME=jammy

A led on the debugger is green and turns red after sending that command, just in case

mehrdad@LAPTOP-DHGJM4R6:~$ JLinkGDBServer -if JTAG -device MIMX8MM6_M4 -NoGui
SEGGER J-Link GDB Server V7.70c Command Line Version

JLinkARM.dll V7.70c (DLL compiled Aug 18 2022 17:29:50)

Command line: -if JTAG -device MIMX8MM6_M4 -NoGui
-----GDB Server start settings-----
GDBInit file: none
GDB Server Listening port: 2331
SWO raw output listening port: 2332
Terminal I/O port: 2333
Accept remote connection: yes
Generate logfile: off
Verify download: off
Init regs on start: off
Silent mode: off
Single run mode: off
Target connection timeout: 0 ms
------J-Link related settings------
J-Link Host interface: USB
J-Link script: none
J-Link settings file: none
------Target related settings------
Target device: MIMX8MM6_M4
Target device parameters: none
Target interface: JTAG
Target interface speed: 4000kHz
Target endian: little

Connecting to J-Link…
Connecting to J-Link failed. Connected correctly?
GDBServer will be closed…
Shutting down…
Could not connect to J-Link.
Please check power, connection and settings.mehrdad@LAPTOP-DHGJM4R6:~$

Best regards,
Mehrdad

Hello @Mehrdad,

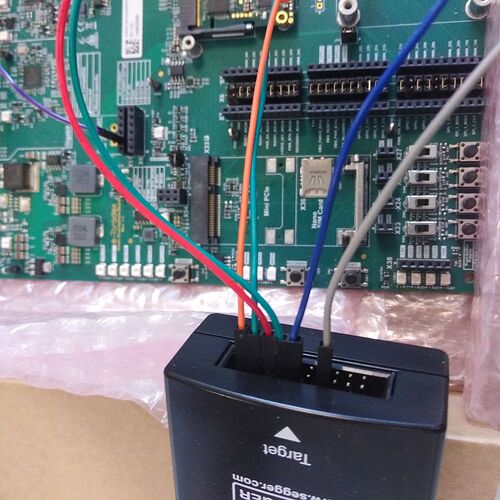
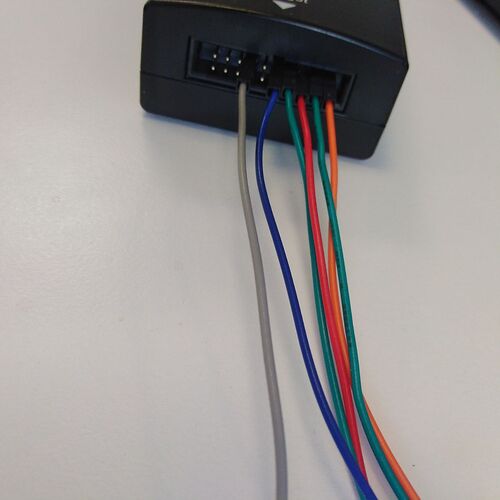
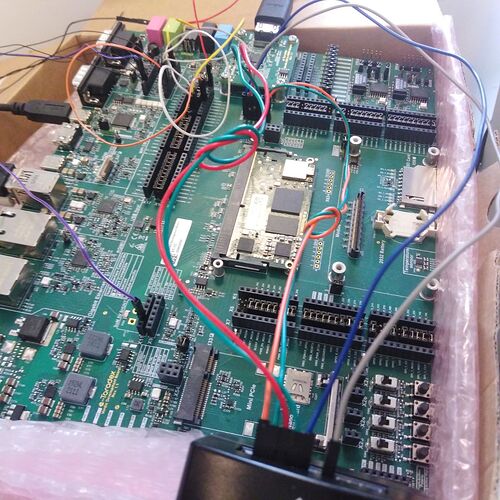
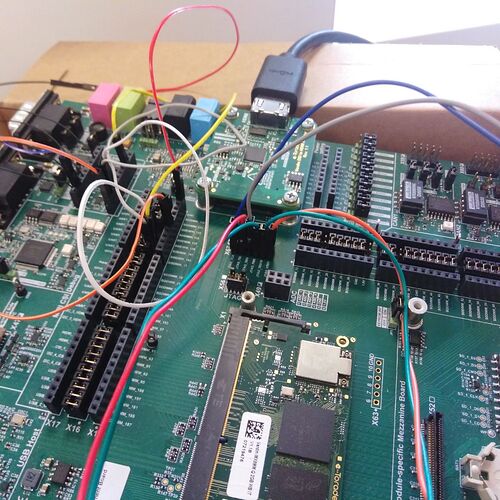
Could you please send me a picture of your cable setup (the connection between the debugger and the board)?


Hi @Mehrdad,

The connections look good to me. At this point, I would ask you to do some basic checks.

  1. Check if the debugger is connected to your host PC via USB.
  2. Check if the module is powered on. (I don’t see any LEDs turned ON on the carrier board from the pictures you sent me).
  3. You could also measure the voltage on the pins on the X67 connector. Does the VREF measure to 1.8V ?

Thanks for your time.

Hi @Mehrdad,

Strange indeed! Before trying the JTAG debugging, have you made sure that the binary is loaded into Cortex M and that you could run it on the M core?

Hi @rudhi.tx ,
thank you so much for sharing the page, yes I created a binary file and an elf file from there and unfortunately I don’t know what is the issue.
Best regards,
Mehrdad

Hi @Mehrdad,

Have you connected the GND from the debugger to any GND on the board? The GND connection is necessary.
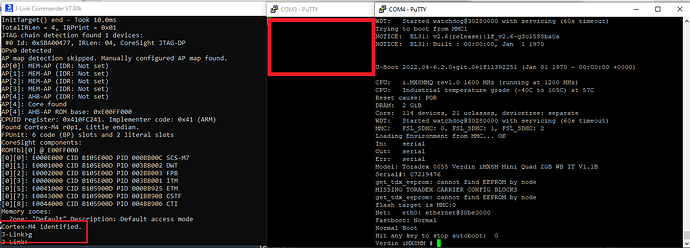
Also, you have to make sure that you stop in U-boot after loading the binary on the cortex-m.

Hi @rudhi.tx ,

Thank you for your advice and yes, I connected three or four pins of the debugger before.

Would you mind explaining this in more detail? The problem is that I cannot connect to the debugger.

Best regards,
Mehrdad