Hi all,
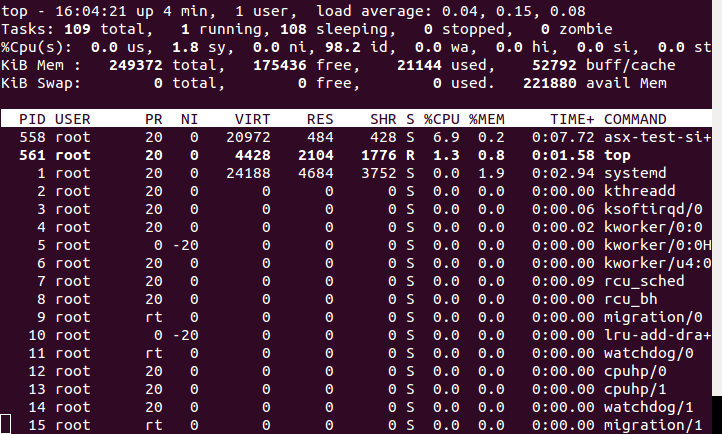
when I watch the CPU-usage of my system with top I see some strange values.
Is shows 98% idle while a single process uses 26%.
How can that be?
Which values are correct, it any?
Thanks,
Dietmar
Hi all,
when I watch the CPU-usage of my system with top I see some strange values.
Is shows 98% idle while a single process uses 26%.
How can that be?
Which values are correct, it any?
Thanks,
Dietmar
You are probably mixing some concepts here: On Linux at least, the load average and CPU utilization are actually two different things. Load average is a measurement of how many tasks are waiting in a kernel run queue (not just CPU time but also disk activity) over a period of time. CPU utilization is a measure of how busy the CPU is right now.
Further note, that load average is given as fraction smaller than one while the CPU utilisation is given in percent and each CPU in an SMP system accounts for its own 100 percent.
Hi Marcel,
it’s not the loadavg I’m talking about, but the CPU utilization in the 3rd line.
According to this the CPU is running 1.6% in kernel space, 0.0% in user space and 98.4% idle.
But the most busy process (pid 606) alone uses 25.9% CPU.
Have you tried this on our stock demo image as well?
I assume your custom image configures something special which may give you strange numbers.
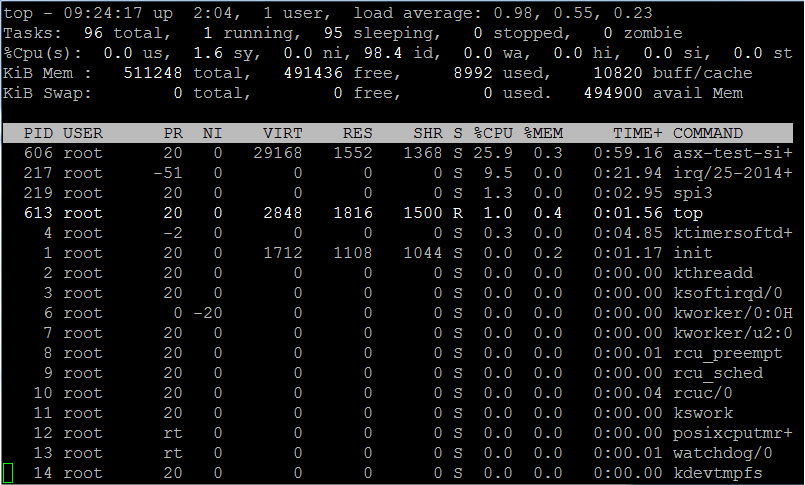
I tried it with the Colibri-iMX6_Console-Image 2.8b2 from stock:
# uname -a
Linux colibri-imx6 4.9.84-2.8.2+gb2a7f2f #1 SMP
but still the sum of the per-process-load is 8.2% while the CPU is 98.2% idle:
By the way the environment of my initial post is wrong. I used a Kernel build by Yocto from a Toradex-Recipe with a custom config:
# uname -a
Linux colibri-imx6 4.9.87-rt62+g3bb6e32 #3 PREEMPT RT
Addition:
My application runs in 4 threads, 3 of them as realtime. May this have any impact to usage-calculation by the kernel?
hi Dietmar
Thanks for the updated Information.
I tried it with the Colibri-iMX6_Console-Image 2.8b2 from stock but still the sum of the per-process-load is 8.2% while the CPU is 98.2% idle
You should try update to Bsp 2.8b5, since the old beta Bsp releases are not supported anymore. Did you let top run for some time like top -n 10 or did you just checked for the first results. It can be that the first results are just wrong. According to the top documentation, the sum of all the percentages in 3rd row must be 100%. That’s all. Alternatively you can try the command htop and check if this gives you better results.
My application runs in 4 threads, 3 of them as realtime. May this have any impact to usage-calculation by the kernel?
Yeah, maybe the calculation is not correct due to Preempt Patch. For the threads you can try the command top -H and check if you see a difference.
Best regards, Jaski
Hi Jaski,
yes I ran top for some time (several minutes). The sum of the 3rd row is 100%, that’s correct, that’s fine.
I ran top -H and the sum of the threads of my process is more or less (the usage is not constant) what top (without -H) shows for the whole process.
I also tries htop but it shows the same: ~30% for my process while ~98% idle in the 3rd row.
Anything else would make me wonder, because htop also uses the statistics the kernel provides in /proc/stat, respectively /proc/$PID/stat, or am I wrong?
I’ve been using Linux since the 1.x.x-Kernels on Intel-, SPARC- and ARM-architectures, but I’ve never seen something like this before.
Neverthless it’s the first time I use realtime-patched kernels and write realtime-applications.
So I also think it must have something to do with the realtime-patch or my application running in realtime-threads.
I’m still confused which values to trust.
Thanks,
Dietmar
Hi
I also tries htop but it shows the same: ~30% for my process while ~98% idle in the 3rd row. Anything else would make me wonder, because htop also uses the statistics the kernel provides in /proc/stat, respectively /proc/$PID/stat, or am I wrong?
No, you are right. Htop and top should show similar results.
Neverthless it’s the first time I use realtime-patched kernels and write realtime-applications. So I also think it must have something to do with the realtime-patch or my application running in realtime-threads.
I think also that with realtime patch is the root cause of the inconsistent cpu usage problem. You could also calculate the cpu usage by yourself with the Information on this site or use the perf tool. For the Iperf tool, you need to compile a custom image with the tool included in this.
Best regards, Jaski
Hi Jaski,
I already know Leo-G’s page and did my own cpu-usage calculation but it shows the same results as top and htop do. No wonder, it uses the same values from /proc/stat.
Meanwile I added perf to my yocto-image and enabled profiling in my kernel
# perf stat -p 874 sleep 30

 Performance counter stats for process id '874':

      14573.849009      task-clock (msec)         #    0.485 CPUs utilized
            280442      context-switches          #    0.019 M/sec                    (100.00%)
                 0      cpu-migrations            #    0.000 K/sec                    (100.00%)
                 0      page-faults               #    0.000 K/sec                    (100.00%)
       10591028727      cycles                    #    0.727 GHz
                 0      instructions              #    0.00  insn per cycle
                 0      branches                  #    0.000 K/sec
                 0      branch-misses             #    0.00% of all branches

      30.041111671 seconds time elapsed
shows a cpu-usage of 48.5% by my process (pid 874).
# perf stat -a sleep 30

 Performance counter stats for 'system wide':

      30016.036013      cpu-clock (msec)          #    1.000 CPUs utilized
            529420      context-switches          #    0.018 M/sec
                 0      cpu-migrations            #    0.000 K/sec
                71      page-faults               #    0.002 K/sec
       12941481917      cycles                    #    0.431 GHz
                 0      instructions              #    0.00  insn per cycle
                 0      branches                  #    0.000 K/sec
                 0      branch-misses             #    0.00% of all branches

      30.016151337 seconds time elapsed
shows a total cpu-usage of 100%, while top says the cpu is 93.4% idle.
Nearly 50% for my process is more than expected.
Do I read the results right?
Why perf says the cpu is totaly busy while top says there is nearly nothing to do?
Thanks,
Dietmar
hi
Thanks for this Information. Could you try the following:
perf record -a sleep 5perf reportand check the results.
Hi Jaski,
here the results:
Samples: 6K of event 'cycles:ppp', Event count (approx.): 615813600
Overhead  Command        Shared Object       Symbol
  20.93%  swapper        [kernel.kallsyms]   [k] cpuidle_enter_state
   7.11%  swapper        [kernel.kallsyms]   [k] finish_task_switch
   3.64%  asx-linux      [kernel.kallsyms]   [k] finish_task_switch
   3.04%  kworker/u2:1   [kernel.kallsyms]   [k] finish_task_switch
   2.80%  kworker/0:2    [kernel.kallsyms]   [k] finish_task_switch
   2.69%  asx-linux      [kernel.kallsyms]   [k] hrtimer_start_range_ns
   2.47%  asx-linux      asx-linux           [.] asx_tsk_search_space.part.0
   2.20%  asx-linux      asx-linux           [.] asx_scheduler
   1.53%  kworker/u2:1   [kernel.kallsyms]   [k] try_to_wake_up
   1.50%  asx-linux      [kernel.kallsyms]   [k] ktime_get_ts64
   1.46%  asx-linux      asx-linux           [.] asx_mbox_receive
   1.45%  asx-linux      [kernel.kallsyms]   [k] vector_swi
   1.16%  asx-linux      libpthread-2.26.so  [.] __pthread_mutex_trylock
   1.07%  kworker/0:2    [kernel.kallsyms]   [k] rt_spin_lock_slowlock
   0.87%  irq/62-sdma    [kernel.kallsyms]   [k] finish_task_switch
   0.80%  asx-linux      libc-2.26.so        [.] __clock_gettime
   0.79%  asx-linux      asx-linux           [.] can_task.part.1
   0.75%  asx-linux      [kernel.kallsyms]   [k] n_tty_read
   0.65%  asx-linux      [kernel.kallsyms]   [k] arm_copy_to_user
   0.60%  kworker/u2:1   [kernel.kallsyms]   [k] rt_spin_lock_slowunlock
   0.55%  asx-linux      asx-linux           [.] asx_mbox_check_task_mail
   0.53%  asx-linux      [kernel.kallsyms]   [k] sys_clock_nanosleep
   0.50%  asx-linux      libc-2.26.so        [.] __clock_nanosleep
   0.48%  asx-linux      [kernel.kallsyms]   [k] sys_clock_gettime
   0.44%  asx-linux      [kernel.kallsyms]   [k] sys_recvfrom
   0.43%  asx-linux      [kernel.kallsyms]   [k] __skb_try_recv_datagram
   0.42%  swapper        [kernel.kallsyms]   [k] cpu_startup_entry
   0.41%  ksoftirqd/0    [kernel.kallsyms]   [k] finish_task_switch
   0.36%  asx-linux      libpthread-2.26.so  [.] recv
   0.33%  asx-linux      [kernel.kallsyms]   [k] __fget
   0.33%  asx-linux      [kernel.kallsyms]   [k] __hrtimer_nanosleep
   0.33%  kworker/u2:1   [kernel.kallsyms]   [k] n_tty_receive_buf_common
   0.33%  asx-linux      [can_raw]           [k] raw_recvmsg
   0.33%  asx-linux      [kernel.kallsyms]   [k] ret_fast_syscall
   0.32%  asx-linux      libisoapp2.so       [.] IsoAlRunPGN
   0.32%  asx-linux      [kernel.kallsyms]   [k] try_to_wake_up
   0.32%  asx-linux      [kernel.kallsyms]   [k] __memzero
   0.31%  asx-linux      libc-2.26.so        [.] vfprintf
   0.31%  asx-linux      [kernel.kallsyms]   [k] __skb_recv_datagram
   0.31%  irq/62-sdma    [kernel.kallsyms]   [k] sdma_int_handler
   0.30%  asx-linux      asx-linux           [.] msl_main_task
   0.30%  asx-linux      [kernel.kallsyms]   [k] do_nanosleep
   0.30%  asx-linux      [kernel.kallsyms]   [k] schedule
   0.29%  asx-linux      [kernel.kallsyms]   [k] hrtimer_init
   0.29%  asx-linux      asx-linux           [.] __udivmoddi4
   0.28%  irq/62-sdma    [kernel.kallsyms]   [k] irq_finalize_oneshot.part.0
   0.28%  asx-linux      libpthread-2.26.so  [.] 0x00009fa8
   0.28%  asx-linux      [kernel.kallsyms]   [k] __und_usr
   0.27%  asx-linux      [kernel.kallsyms]   [k] rt_spin_lock
It seems like that the CPU is 21% idle. You can check also with perf top, if this is correct?
Hi Jaski,
how can I get the idle time with perf top?
It show only something like this:
Samples: 179K of event 'cycles:ppp', Event count (approx.): 8575111423
Overhead  Shared Object              Symbol
  10.98%  [kernel]                   [k] finish_task_switch
   6.40%  [kernel]                   [k] cpuidle_enter_state
   6.08%  [spi_imx]                  [k] spi_imx_buf_rx_swap
   5.94%  [spi_imx]                  [k] mx51_ecspi_rx_available
   4.81%  [spi_imx]                  [k] spi_imx_buf_tx_swap
   2.01%  [kernel]                   [k] try_to_wake_up
   1.46%  asx-linux                  [.] asx_tsk_search_space.part.0
   1.19%  perf                       [.] perf_hpp__is_dynamic_entry
   0.97%  perf                       [.] dso__find_symbol
Why do you think the CPU in 21% idle?
Is it the cpuidle_enter_state in the swapper?
Regards,
Dietmar
Hi @Dietmar
Why do you think the CPU in 21% idle? Is it the cpuidle_enter_state in the swapper?
I thought this since the CPU is in cpuidle_enter_state during 20.93% but I don’t know if this is correct. Actually it seems that with the preempt patch this whole cpu usage calculation is not correctly done with top or perf.
Usually when someone uses Preempt patch, he doesn’t care about CPU Usage but about the Jitter in his Application. So what is your issue at the end?
Best regards, Jaski
Hi Jaski,
that’s not the answer I wished for…
However, nevertheless I can measure the load of my own process by measuring the time it needs for it’s work.
For our application a low jitter is important. But it’s also important, that is has done it’s work before it’s time for the next run.
Thanks,
Dietmar
Hi
Yeah sorry, I don’t have any different answer for you.
Best regards, Jaski