I was wondering how to monitor GPU usage on TorizonCore. I am using TorizonCore 6.1.0 with a Verdin iMX8M Plus.
I tried modifying the image using Yocto and following this: Install gputop on imx8mp verdin - Technical Support - Toradex Community
However, this did not work as intended. No gpuProfiler seems to be there and gpuinfo.sh script returns that the platform is not supported.
What is a simple way to monitor GPU usage on TorizonCore ?
However, this did not work as intended. No gpuProfiler seems to be there and gpuinfo.sh script returns that the platform is not supported.
Looking at the other thread you referenced, this seems like the outcome the other customer got as well.
As an alternative GPU monitoring tool we have tried gputop. We have a proof of concept container with gputop you can try out. To do so here are the following steps:
First of all on TorizonCore you need to set some kernel arguments like so: sudo fw_setenv tdxargs "galcore.powerManagement=0 galcore.showArgs=1 galcore.gpuProfiler=1"
You’ll need to reboot after doing this to apply the new arguments. After the reboot check /proc/cmdlin to make sure these were applied.
Then you can run a container that has the gputop tool built in like so: docker run -it --privileged yagomellotoradex/imxgputop:0.1.0
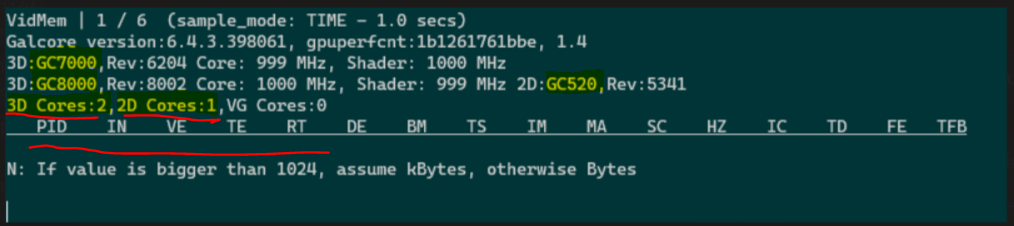
This should bring up some text output with information on the GPU, you can navigate the information with the left and right arrow keys. The text output flickers whenever it refreshes but apparently this is normal.
On a side-note this gputop tool is provided and maintained by NXP. For more information on the tool and how to interpret the output you can find the repository for this tool here: https://source.codeaurora.org/external/imx/imx-gputop/
The tool is just provided as is, we can’t help much with any issues or questions with the tool since as I said it comes all from NXP.
I’ve just tried the proof of concept container with gputop, but it doesn’t work.
I mean, it says that no client are attached to GPU, and all the usage info are not filled.
The only fields that are filled are related to DDR0 and DDR1.
@vix Assuming you set the required kernel arguments and launched the container correctly, I’m not sure what could be the issue. That said this container really was just a one-time proof of concept and we don’t actively maintain it. There’s also the tool itself which I’m not too versed on it’s mechanics since it’s created and maintained by NXP: GitHub - nxp-imx/imx-gputop: i.MX GPU Performance Tool
It’s pretty straightforward it’s mostly just cloning and building the tool from NXP directly. If there’s any issues with the tool itself you’ll need to raise this with NXP who maintains the tool.
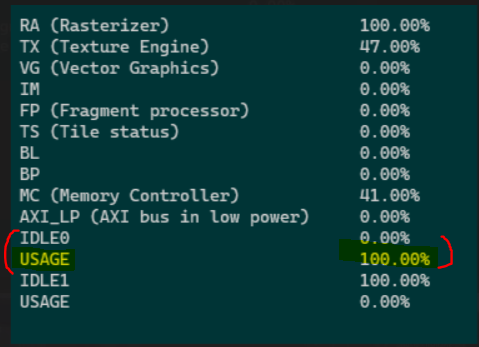
It seems that the GPU node 0 is 100% loaded (I think that the node 1 is the “fake” CG8000).
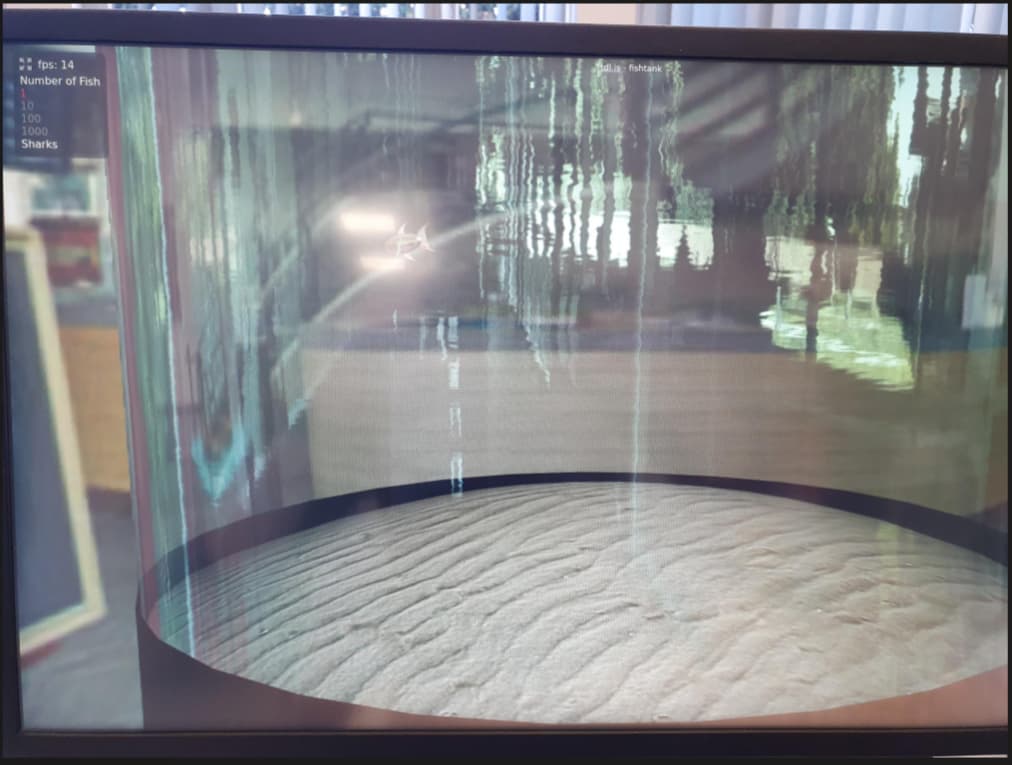
Based on my expectations, the performances are quite poor (14 fps with 1 fish)
There were possible issues found with our chromium container and hardware acceleration on the Verdin i.MX8M Plus. Nothing was done here yet, so these issues are probably still present. Therefore it doesn’t really make sense to examine the performance of our chromium container here given the known issues.
I know,
but for our project, this issue is a showstopper.
And so we’ve bee spending time in investigating by ourselves, because at the moment there isn’t a date for a fix from Toradex (I understand this, it’s up to Toradex fix the roadmap).
I add to the community every new info I get, in case it is useful to other users.
Let me know if I can do something to help Toradex engineers debugging or testing the issue.