Hello,
I’m trying to develop M4 applications for our IMX8 chip but I’m having trouble doing that.
I downloaded the SDK from NXP (MIMX8QM6xxxFF) and I was able to build the “hello world” project, flash it into and SD card a load into the chip.
However, I’m not being able to debug it. I have a SEGGER J-link probe and I’m using IAR toolchain for the moment (I’d like to use VS Code instead in the future with GCC toolchain).
I followed this guide (High performance, low power Embedded Computing Systems | Toradex Developer Center), but doesn’t say how to compile/debug a project but only how to install all the software necessary for that.
I’d like to know step by step how to debug a project (setup, software I need to have installed, etc), like the “hello world”, so I can begin with the actual project I have in my company.
My PC runs on Windows 10.
Thank you.
Greetings @juanigevo!
We’re currently working on updating the documentation on this, but I can instruct you on how to debug a project with the SEGGER J-Link and the Cortex-Debug extension.
I’ve had success using the following launch.json file to Run and Debug an already compiled .elf application (note for the paths you’ll have to change):
{
    "version": "0.2.0",
    "configurations": [
        {
            "name": "Cortex Debug",
            "cwd": "${workspaceRoot}/boards/mekmimx8qm/demo_apps/hello_world/cm4_core0/",
            "executable": "armgcc/debug/hello_world_m40.elf",
            "request": "attach",
            "device": "MIMX8QM6_M4_0",
            "interface": "jtag",
            "type": "cortex-debug",
            "servertype": "jlink",
            "postAttachCommands": [
                "monitor reset",
                "monitor halt",
                "load",
                "monitor go"
            ]
        }
    ]
}
Then just launch the Run and Debug option using this configuration. Execution should stop on the Reset handler and you can then use all debug functionalities (stepping, breakpoints, etc). Let me know if this works for you.
Hi Gustavo,
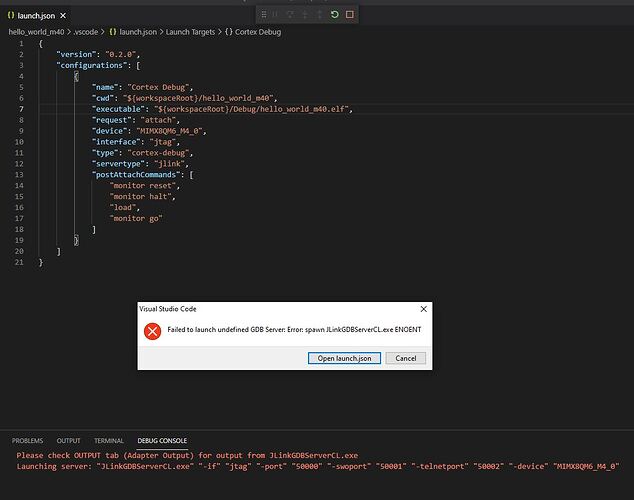
Sadly I had no luck debugging the project. I an error arises when I try to debug with the file you sent me. I’m attaching a photo for you to see it.
Thanks.
Although I just tested this on Linux, make sure you can launch the J-Link GDB Server manually - just to see if it works. This also has to be on your path. If you installed the J-Link tools somewhere else than the default location, you have to specify the path to that on the Cortex-Debug extension settings.
Unfortunately I don’t have a Windows setup ready to test this, but I might try to set something up and let you know.
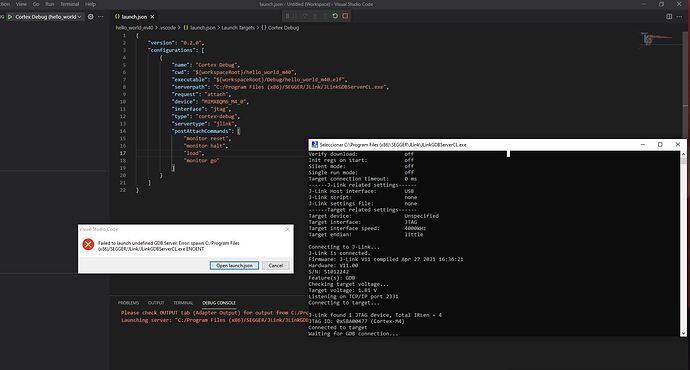
I installed the GDB server in the default location. I was able to launch it manually. However, the same problem persist (see image).
In the pdf “Getting Started with MCUXpresso SDK for i.MX 8QuadMax” on section 4.2.3 says:
"4.2.3 Run an example application
This section describes steps to run a demo application using J-Link GDB Server application. To perform this exercise, the
following step must be done:
• Make a bootable SD card with the SCFW (System Controller Firmware) image. See Section 6.3, “Make a bootable SD
card with System Controller Firmware (SCFW)”. You have a standalone J-Link pod that is connected to the debug
interface of your board. Make sure the Segger J-Link software i.MX 8QM supporting patch,
iar_segger_support_patch_8qm.zip is installed."
Does this has anything to do with my problem or its unrelated? I don’t know how to make a bootable SD card with the SCFW.
Thanks
Hello Gustavo,
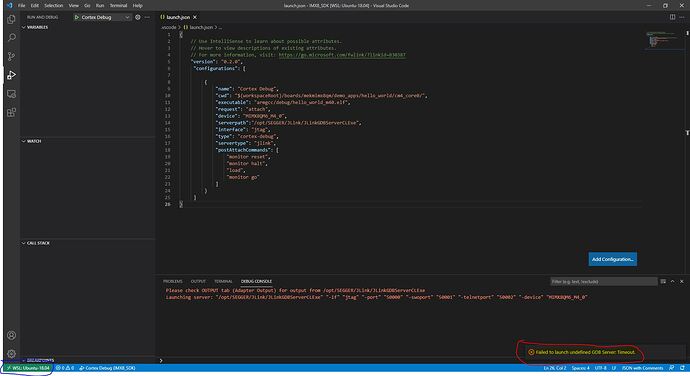
I tried working on Ubuntu with Windows Subsystem for Linux and I was able to build the project. However, when I tried to run de debugger, it gave me a timeout error this time, not the error I got in Windows. I’m suspecting it may have something to do with the hardware.
Could you give me the exact setup in which you tested your project so I can check I’m not missing any connection, jumper, anything?
Thanks,
Juan
Is this issue solved for you after our email exchange? Let me know if you need anything else from my side.
Also, we’re still working on figuring how to do this in a reliable way and documenting it.
Hi @gustavo.tx,
The problem was solved after setting the executable path correctly. Apparently the debugger or the IDE couldn’t find it so it gave me that error. But the error message didn’t lead me to an error of that kind, that’s why it took me so long to find it.
If you are working on a guide, could you include a section on how to build/debug the project on Eclipse IDE, I’ve tried to make it work there and couldn’t.
Thanks


