Cortex-M hello_world example for Verdin iMX8M-Plus strange behavior

After some weeks of experience with Verdin iMX8M-Mini, I switched to iMX8M-Plus (because this is the best SoM for my project).
With iMX8M-Mini I was able to debug hello_world project wihtout any problem (setting breakpoints, step by step , …)

I configured the Cortex-M development as described here, and it’s basically the same as IMX8M-Mini.
I’m able to build the hello_world example supplied with MCUXpress SDK from NXP and load it using Segger J-Link debug probe and VS Code.
But what I see during the debug is not what I expect.

The first messages from gdb server seems ok to me

SEGGER J-Link GDB Server V7.86f Command Line Version

JLinkARM.dll V7.86f (DLL compiled Mar 29 2023 16:39:17)

Command line: -singlerun -nogui -if jtag -port 50000 -swoport 50001 -telnetport 50002 -device MIMX8ML8_M7 -jlinkscriptfile D:\repos\GAR\ERxx\cortex-m\SDK_2_13_0_MIMX8ML8xxxKZ/tools/iar_segger_support_patch_imx8mp/JLink/Devices/NXP/iMX8ML/NXP_iMX8M_Connect_CortexM7.JLinkScript
-----GDB Server start settings-----
GDBInit file:                  none
GDB Server Listening port:     50000
SWO raw output listening port: 50001
Terminal I/O port:             50002
Accept remote connection:      localhost only
Generate logfile:              off
Verify download:               off
Init regs on start:            off
Silent mode:                   off
Single run mode:               on
Target connection timeout:     0 ms
------J-Link related settings------
J-Link Host interface:         USB
J-Link script:                 D:\repos\GAR\ERxx\cortex-m\SDK_2_13_0_MIMX8ML8xxxKZ/tools/iar_segger_support_patch_imx8mp/JLink/Devices/NXP/iMX8ML/NXP_iMX8M_Connect_CortexM7.JLinkScript
J-Link settings file:          none
------Target related settings------
Target device:                 MIMX8ML8_M7
Target device parameters:      none
Target interface:              JTAG
Target interface speed:        4000kHz
Target endian:                 little

Connecting to J-Link...
J-Link is connected.
Firmware: J-Link V11 compiled Mar 28 2023 16:59:55
Hardware: V11.00
S/N: 601013959
Feature(s): RDI, FlashBP, FlashDL, JFlash, GDB
Checking target voltage...
Target voltage: 1.80 V
Listening on TCP/IP port 50000
Connecting to target...

J-Link found 1 JTAG device, Total IRLen = 4
JTAG ID: 0x5BA00477 (Cortex-M7)
Halting core...
Connected to target
Waiting for GDB connection...Connected to 0000:0000:0000:0000:0000:0000:0000:0001
GDB client (conn. 712) requested target.xml from GDB Server
Reading common registers: Read register 'r0' (4 bytes) from hardware: 0x00000000
Read register 'r1' (4 bytes) from hardware: 0x00000000
Read register 'r2' (4 bytes) from hardware: 0x00000000
Read register 'r3' (4 bytes) from hardware: 0x00000000
Read register 'r4' (4 bytes) from hardware: 0x00000000
Read register 'r5' (4 bytes) from hardware: 0x00000000
Read register 'r6' (4 bytes) from hardware: 0x00000000
Read register 'r7' (4 bytes) from hardware: 0x00000000
Read register 'r8' (4 bytes) from hardware: 0x00000000
Read register 'r9' (4 bytes) from hardware: 0x00000000
Read register 'r10' (4 bytes) from hardware: 0x00000000
Read register 'r11' (4 bytes) from hardware: 0x00000000
Read register 'r12' (4 bytes) from hardware: 0x00000000
Read register 'sp' (4 bytes) from hardware: 0x00000220
Read register 'lr' (4 bytes) from hardware: 0xFFFFFFFF
Read register 'pc' (4 bytes) from hardware: 0x08000000
Read register 'xpsr' (4 bytes) from hardware: 0x00000001
WARNING: Failed to read memory @ address 0x00000008
Received monitor command: halt
Halting target CPU...

But then I see

ERROR: Cannot read register 15 (R15) while CPU is running
...Target halted (PC = 0x00000000)
Received monitor command: reset
ERROR: Failed to halt CPU.
Resetting target
Received monitor command: halt
Halting target CPU...
ERROR: Cannot read register 15 (R15) while CPU is running
...Target halted (PC = 0x00000000)

Ant this seems sytrange to me.
The log goes on

Downloading 680 bytes @ address 0x00000000
Downloading 16 bytes @ address 0x00000400
Downloading 16112 bytes @ address 0x00000410
Downloading 1300 bytes @ address 0x00004300
Downloading 8 bytes @ address 0x00004814
Downloading 4 bytes @ address 0x0000481C
Downloading 4 bytes @ address 0x00004820
Downloading 4 bytes @ address 0x00004824
Writing register 'pc' = 0x0000048C

This should be the loading of the firmware, and the setting of PC register.
And I see it writes into the memory region which is the 128kB ITCM for Cortex-M7 (as per Hardware Reference Manual), as specified by the .ld file used to compile.
Then a lot of errors come out:

Reading 64 bytes @ address 0x00003580
WARNING: Failed to read memory @ address 0x00003590
Reading 64 bytes @ address 0x00002BC0
WARNING: Failed to read memory @ address 0x00002BEC
Reading 64 bytes @ address 0x00000B80
WARNING: Failed to read memory @ address 0x00000B8A
WARNING: Failed to read memory @ address 0x00000B9E
WARNING: Failed to read memory @ address 0x0000048C
WARNING: Failed to read memory @ address 0xFFFFFFFE
Reading 64 bytes @ address 0x2001FFC0
ERROR: Cannot read register 17 (MSP) while CPU is running
Reading register 'msp' = 0xDEADBEEF
ERROR: Cannot read register 18 (PSP) while CPU is running
Reading register 'psp' = 0xDEADBEEF
ERROR: Cannot read register 24 (PRIMASK) while CPU is running
Reading register 'primask' = 0xDEADBEEF
ERROR: Cannot read register 88 (CM3_R??) while CPU is running
Reading register 'basepri' = 0xDEADBEEF
ERROR: Cannot read register 89 (CM3_R??) while CPU is running
Reading register 'faultmask' = 0xDEADBEEF
ERROR: Cannot read register 90 (CM3_R??) while CPU is running
Reading register 'control' = 0xDEADBEEF
ERROR: Cannot read register 21 (APSR) while CPU is running
Reading register 'apsr' = 0xDEADBEEF
ERROR: Cannot read register 22 (EPSR) while CPU is running
Reading register 'epsr' = 0xDEADBEEF
ERROR: Cannot read register 23 (IPSR) while CPU is running
Reading register 'ipsr' = 0xDEADBEEF
ERROR: Cannot read register 29 (IAPSR) while CPU is running
Reading register 'iapsr' = 0xDEADBEEF
ERROR: Cannot read register 30 (EAPSR) while CPU is running
Reading register 'eapsr' = 0xDEADBEEF
ERROR: Cannot read register 31 (IEPSR) while CPU is running
Reading register 'iepsr' = 0xDEADBEEF
ERROR: Cannot read register 32 (FPSCR) while CPU is running
Reading register 'fpscr' = 0xDEADBEEF
ERROR: Cannot read register 33 (FPS0) while CPU is running
Reading register 's0' = 0xDEADBEEF
ERROR: Cannot read register 34 (FPS1) while CPU is running
Reading register 's1' = 0xDEADBEEF
ERROR: Cannot read register 35 (FPS2) while CPU is running
Reading register 's2' = 0xDEADBEEF
ERROR: Cannot read register 36 (FPS3) while CPU is running
Reading register 's3' = 0xDEADBEEF
ERROR: Cannot read register 37 (FPS4) while CPU is running
Reading register 's4' = 0xDEADBEEF
ERROR: Cannot read register 38 (FPS5) while CPU is running
Reading register 's5' = 0xDEADBEEF
ERROR: Cannot read register 39 (FPS6) while CPU is running
Reading register 's6' = 0xDEADBEEF
ERROR: Cannot read register 40 (FPS7) while CPU is running
Reading register 's7' = 0xDEADBEEF
ERROR: Cannot read register 41 (FPS8) while CPU is running
Reading register 's8' = 0xDEADBEEF
ERROR: Cannot read register 42 (FPS9) while CPU is running
Reading register 's9' = 0xDEADBEEF
ERROR: Cannot read register 43 (FPS10) while CPU is running
Reading register 's10' = 0xDEADBEEF
ERROR: Cannot read register 44 (FPS11) while CPU is running
Reading register 's11' = 0xDEADBEEF
ERROR: Cannot read register 45 (FPS12) while CPU is running
Reading register 's12' = 0xDEADBEEF
ERROR: Cannot read register 46 (FPS13) while CPU is running
Reading register 's13' = 0xDEADBEEF
ERROR: Cannot read register 47 (FPS14) while CPU is running
Reading register 's14' = 0xDEADBEEF
ERROR: Cannot read register 48 (FPS15) while CPU is running
Reading register 's15' = 0xDEADBEEF
ERROR: Cannot read register 49 (FPS16) while CPU is running
Reading register 's16' = 0xDEADBEEF
ERROR: Cannot read register 50 (FPS17) while CPU is running
Reading register 's17' = 0xDEADBEEF
ERROR: Cannot read register 51 (FPS18) while CPU is running
Reading register 's18' = 0xDEADBEEF
ERROR: Cannot read register 52 (FPS19) while CPU is running
Reading register 's19' = 0xDEADBEEF
ERROR: Cannot read register 53 (FPS20) while CPU is running
Reading register 's20' = 0xDEADBEEF
ERROR: Cannot read register 54 (FPS21) while CPU is running
Reading register 's21' = 0xDEADBEEF
ERROR: Cannot read register 55 (FPS22) while CPU is running
Reading register 's22' = 0xDEADBEEF
ERROR: Cannot read register 56 (FPS23) while CPU is running
Reading register 's23' = 0xDEADBEEF
ERROR: Cannot read register 57 (FPS24) while CPU is running
Reading register 's24' = 0xDEADBEEF
ERROR: Cannot read register 58 (FPS25) while CPU is running
Reading register 's25' = 0xDEADBEEF
ERROR: Cannot read register 59 (FPS26) while CPU is running
Reading register 's26' = 0xDEADBEEF
ERROR: Cannot read register 60 (FPS27) while CPU is running
Reading register 's27' = 0xDEADBEEF
ERROR: Cannot read register 61 (FPS28) while CPU is running
Reading register 's28' = 0xDEADBEEF
ERROR: Cannot read register 62 (FPS29) while CPU is running
Reading register 's29' = 0xDEADBEEF
ERROR: Cannot read register 63 (FPS30) while CPU is running
Reading register 's30' = 0xDEADBEEF
ERROR: Cannot read register 64 (FPS31) while CPU is running
Reading register 's31' = 0xDEADBEEF
ERROR: Cannot read register 33 (FPS0) while CPU is running
ERROR: Cannot read register 34 (FPS1) while CPU is running
Reading register 'd0' = 0x00000000
ERROR: Cannot read register 35 (FPS2) while CPU is running
ERROR: Cannot read register 36 (FPS3) while CPU is running
Reading register 'd1' = 0x00000000
ERROR: Cannot read register 37 (FPS4) while CPU is running
ERROR: Cannot read register 38 (FPS5) while CPU is running
Reading register 'd2' = 0x00000000
ERROR: Cannot read register 39 (FPS6) while CPU is running
ERROR: Cannot read register 40 (FPS7) while CPU is running
Reading register 'd3' = 0x00000000
ERROR: Cannot read register 41 (FPS8) while CPU is running
ERROR: Cannot read register 42 (FPS9) while CPU is running
Reading register 'd4' = 0x00000000
ERROR: Cannot read register 43 (FPS10) while CPU is running
ERROR: Cannot read register 44 (FPS11) while CPU is running
Reading register 'd5' = 0x00000000
ERROR: Cannot read register 45 (FPS12) while CPU is running
ERROR: Cannot read register 46 (FPS13) while CPU is running
Reading register 'd6' = 0x00000000
ERROR: Cannot read register 47 (FPS14) while CPU is running
ERROR: Cannot read register 48 (FPS15) while CPU is running
Reading register 'd7' = 0x00000000
ERROR: Cannot read register 49 (FPS16) while CPU is running
ERROR: Cannot read register 50 (FPS17) while CPU is running
Reading register 'd8' = 0x00000000
ERROR: Cannot read register 51 (FPS18) while CPU is running
ERROR: Cannot read register 52 (FPS19) while CPU is running
Reading register 'd9' = 0x00000000
ERROR: Cannot read register 53 (FPS20) while CPU is running
ERROR: Cannot read register 54 (FPS21) while CPU is running
Reading register 'd10' = 0x00000000
ERROR: Cannot read register 55 (FPS22) while CPU is running
ERROR: Cannot read register 56 (FPS23) while CPU is running
Reading register 'd11' = 0x00000000
ERROR: Cannot read register 57 (FPS24) while CPU is running
ERROR: Cannot read register 58 (FPS25) while CPU is running
Reading register 'd12' = 0x00000000
ERROR: Cannot read register 59 (FPS26) while CPU is running
ERROR: Cannot read register 60 (FPS27) while CPU is running
Reading register 'd13' = 0x00000000
ERROR: Cannot read register 61 (FPS28) while CPU is running
ERROR: Cannot read register 62 (FPS29) while CPU is running
Reading register 'd14' = 0x00000000
ERROR: Cannot read register 63 (FPS30) while CPU is running
ERROR: Cannot read register 64 (FPS31) while CPU is running
Reading register 'd15' = 0x00000000
WARNING: Failed to read memory @ address 0xFFFFFFFE
WARNING: Failed to read memory @ address 0x00000000
WARNING: Failed to read memory @ address 0x00000004
WARNING: Failed to read memory @ address 0x00000008
WARNING: Failed to read memory @ address 0x0000000C
WARNING: Failed to read memory @ address 0x00000010
WARNING: Failed to read memory @ address 0x00000014
WARNING: Failed to read memory @ address 0x00000018
WARNING: Failed to read memory @ address 0x0000001C
WARNING: Failed to read memory @ address 0x00000020
WARNING: Failed to read memory @ address 0x00000022
WARNING: Failed to read memory @ address 0x00000024
WARNING: Failed to read memory @ address 0x00000028
WARNING: Failed to read memory @ address 0x0000002C
WARNING: Failed to read memory @ address 0x0000002D

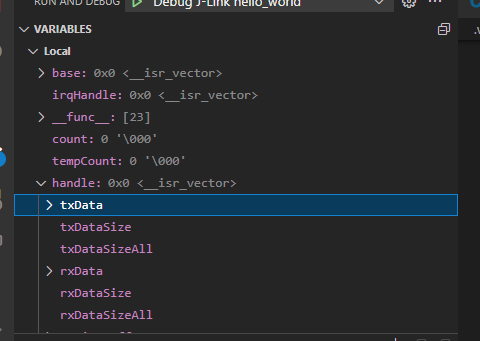
At high level, the execution halts (apparently) inside fsl_uart.c line 1504


I suspect that something is wrong with interrupts or interrupt handlers, because the call stack seems “broken”
immagine
and locals windows, more or less the same
immagine

Can someone help on what happens?

Hi @vix,

I haven’t seen this error before, but it looks like the halt failed. Can you please share your launch.json with us?

It should have the post commands attribute:

"interface": "jtag",
            "postAttachCommands": [
                "monitor reset",
                "monitor halt",
                "load"
            ],

Best Regards,
Hiago.

Hi @hfranco.tx

here is the launch.json

 "name": "Debug J-Link hello_world",
            "type": "cortex-debug",
            "request": "attach",
            "cwd": "${workspaceRoot}/boards/evkmimx8mp/demo_apps/hello_world", // Put here the path for your armgcc folder
            "executable": "armgcc/debug/hello_world.elf", // Select the path for your .elf executable
            "servertype": "jlink",
            "device": "MIMX8ML8_M7", //Select Your Device here
            "interface": "jtag",
            "postAttachCommands": [
                "monitor reset",
                "monitor halt",
                "load"
            ],
            "armToolchainPath": "${config:arm_toolchain_dir}/bin", // Select here the path for your toolchain
            "breakAfterReset": true,
            "showDevDebugOutput": "both",
            "jlinkscript":"${workspaceRoot}/tools/iar_segger_support_patch_imx8mp/JLink/Devices/NXP/iMX8ML/NXP_iMX8M_Connect_CortexM7.JLinkScript",
            "svdFile": "${workspaceRoot}/tools/iar_segger_support_patch_imx8mp/arm/config/debugger/NXP/MIMX8ML8_cm7.svd"

I can add that even removing the elements jlinkscript and svdFile the behavior is the same.
The first execution after I power on the SoM gives a little bit different error

J-Link found 1 JTAG device, Total IRLen = 4
JTAG ID: 0x5BA00477 (Cortex-M7)
Halting core...
Halting target device failed. Trying again with reset
Connected to target
Waiting for GDB connection...Connected to 0000:0000:0000:0000:0000:0000:0000:0001
GDB client (conn. 1112) requested target.xml from GDB Server
Reading common registers: Read register 'r0' (4 bytes) from hardware: 0x00000000
Read register 'r1' (4 bytes) from hardware: 0x00000000
Read register 'r2' (4 bytes) from hardware: 0x00000000
Read register 'r3' (4 bytes) from hardware: 0x00000000
...

But, again, I see
Halting target device failed. Trying again with reset
so I suspect some problems in halting the Cortex-M, as suggested by @hfranco.tx

Hi @hfranco.tx
have you a had a chance to look into this?
Do you have ideas?

Hi @vix,

Sorry for the delay, I’m back now to work on these tickets. I apologize.

I tested on my side but couldn’t reproduce your issue. Is it still a problem? Or do you have any progress on your side?

Best Regards,
Hiago.

Hi @hfranco.tx
Yes, it’s still a problem.

Hi @vix,

To better understand your problem, can you please share information about your setup? I’ll try to reproduce it on my side with the same versions you’re using.

  • What’s the hardware version you’re using? And the Carrier Board version?
  • What’s the OS you’re using on the module? TorizonCore, what version?
  • What’s the OS you’re using on your host computer? Ubuntu? What version?
  • What’s the version of your Jlink Probe and Jlink Software Version?

Best Regards,
Hiago.

  • What’s the hardware version you’re using? And the Carrier Board version?

Verdin iMX8M Plus Quad 4GB Wi-Fi / Bluetooth IT (PN: 0058 )
Verdin Development Board V 1.1B

  • What’s the OS you’re using on the module? TorizonCore, what version?

TorizonCore with evaluation containers
6.2.0-devel-20230416+build.244.container
But I’m not sure if this matters, because when the JTAG connects to Cortex-M7, it resets the Cortex-A.

  • What’s the OS you’re using on your host computer? Ubuntu? What version?

Windows 10 22H2 with latest updates applied

  • What’s the version of your Jlink Probe and Jlink Software Version?

JLink Probe 11.0 - JLink Software V 7.86f

I hope that this helps.

Good day.
I have the exact same situation as vix described with exactly the same devkit - Verdin iMX8M-Plus + Verdin devboard + Jlink. Debug output one to one.

I can add one more point from my side:
when I try to connect with JLink to Cortex-M7, it is not running, it has no firmware loaded before.

I confirm that in this situation , register LR (R14) contains 0xFFFFFFFF.
I get the same value if I use JLink commander utility to connect and read registers.
Is that 0xFFFFFFFF the reason for the request to read from 0xFFFFFFFE that brings to

WARNING: Failed to read memory @ address 0xFFFFFFFE

It’s only an idea, maybe stupid

I’ve been in touch both with NXP and Segger tech support to investigate what happens, but the situation is a mess.

Segger position:
On the website, Segger lists iMX8M-Plus as supported device, but NOT supported by Segger (see last column).
This means that Segger received a JLinkScript file from the vendor NXP and uses it “as it is”.
Segger has on the roadmap the official (i.e., by Segger) support of iMX8M-Plus later this year.

NXP position:
The probe is from Segger, and so the support is up to Segger.
There is the SDK_MX8MP_3RDPARTY_Patch that contains the JLinkScript, but NXP says it’s from Segger…


On NXP community, a NXP Engineer posted a newer JLinkScript for iMX8M-Plus (see here), but NXP tech support has not been able to clarify this situation.
They suggested me to call my NXP FAE, but I don’t have any contact.

I tried with different debuggers:

  • GDB (from VScode)
  • Segger Ozone
  • Segger J-Link Commander
    and in all the cases, the main issue is that the JLink probe is not able to Halt the device. And so I suspect that the JLinkScript needs sonme improvements.
    Since the device cannot be halted consistently, then some other issues came out.

Can someone from Toradex help with this matter? @hfranco.tx maybe you have contact with a NXP FAE?

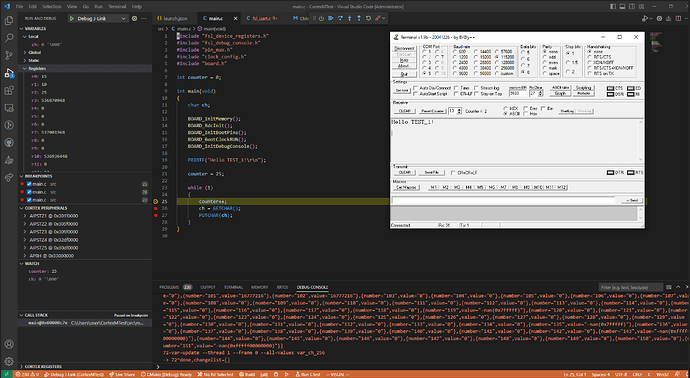
I managed to start debugging my test project through J-Link + Studio Code + Windows.

The situation described by vix was one to one with my test project. Then I tried the “hello_world” project from NXP SDK as described in the documentation. On Linux everything worked right away. Inspired by the result, I tried the same project on Windows - it compiles, uploads, but does not start. After that, I decided to finalize my test project and add modules from the SDK and compilation and linking options to the CMakefile from “hello_world” file. Also, I did NOT specify the jlinkscript patch for the IAR - the default files that came with SEGGER J -Link V7.86h were used.

The general structure of the files has also been changed to a more convenient one in my understanding. The build_debug.bat used its own arm-none-eabi-gcc.cmake instead of the armgcc.cmake that comes in the example. The name MCUX_SDK_PROJECT_NAME in the used components has also been replaced with the standard EXECUTABLE.

Here is also how my launch.json looks like:

{
    "version": "0.2.0",
    "configurations": [
        {
            "cwd": "${workspaceRoot}",
            "executable": "./build/CortexMTest.elf",
            "name": "Debug J-Link",
            "request": "attach",
            "type": "cortex-debug",
            "servertype": "jlink",
            "serverpath": "C:/Program Files/SEGGER/JLink/JLinkGDBServerCL.exe",
            "armToolchainPath": "C:/Program Files (x86)/Arm GNU Toolchain arm-none-eabi/12.2 mpacbti-rel1/bin",
            "device": "MIMX8ML8_M7",
            "interface": "jtag",
            "postAttachCommands": [
                "monitor reset",
                "monitor halt",
                "load"
            ],
            "showDevDebugOutput": "raw",
            "runToEntryPoint": "main",
            "svdFile": "${workspaceRoot}/device/MIMX8ML8_cm7.svd",
        }
    ]
}

For normal operation in Windows with J-Link, you also need to stop the autoboot in the U-boot console by pressing any key at system startup. Then run the debug via F5 in Studio Code - and in my case everything starts working:

Here is a link on my test project:
https://drive.google.com/drive/folders/1gljRiVTDfVKgh8WlWu-CnDuJOrkKjN7Y?usp=sharing

Hello @Stan88
the steps you describe don’t work in my case.
I did a lot of differetn tests, and sometimes I was able to have it workig, but I never understood what is the key point.

I have a couple of questions:

  • is U-Boot configured to load a firmware into Cortex-M or not?
  • is the JLink proble connected to JTAG X56 of Verdin Development Board when you power on the board? Or do you plug the JLink into X56 after the boot is halted in U-Boot?

I did other tests and I’m in touch with Segger tech support (that helps much more than NXP :frowning:) and it seems that the JLink is not able to halt the Cortex-M under some circumstances.

Hi @vix. Let me write down all the steps in detail that I went through in studying this issue. Maybe one of them will help you or someone else from the community.

1. Connection.
To download and debug the firmware, the development board has a built-in FTDI4323 module. It contains 4 COM ports:

  • management of the ON-OFF/ reset of the system;
  • JTAG;
  • USART Cortex A53;
  • USART Cortex M7.

FTDI4323 only requires a standard driver to work with virtual COM ports. There is no separate JTAG driver for this board. And in Windows, the first two ports are not defined as additional devices and there is neither access to them nor a request for additional drivers. The manufacturer also gives instructions only for working under Linux. In Linux, these ports work properly and are visible once without additional drivers.

Therefore, there is only one solution for working with Windows - use SEGGER JLink version 9 and older. My programmer is version 9.6 and it can already work with MIMX8ML8_M7.

Before connecting an external programmer, turn off dev board, remove all jumpers from X67.

I do not have such an adapter for X56, so I connected with pins instead of jumpers - this is a completely working option too:

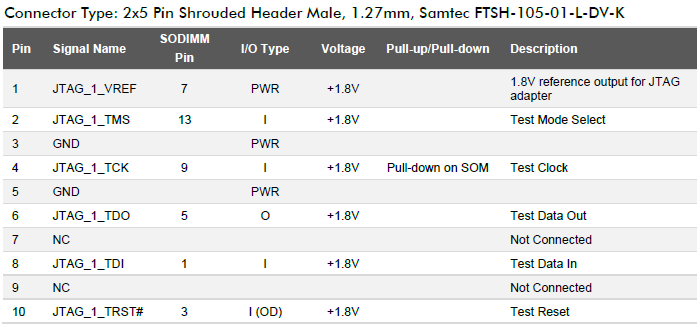
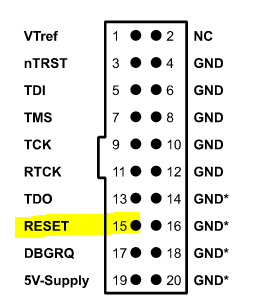
According to the documentation and the description on the board, the following signals are output to the X56 connector:

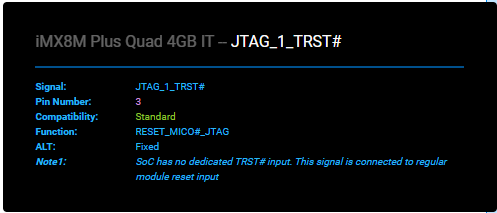
But this is not entirely correct. With the current connection, JFlash sees the controller but cannot connect. 10 pin JTAG_1_TRST# - this is not a Test Reset , but a reset of the entire module - nRESET . This information was found using the output configuration utility - Web Pinout Designer Tool :

image

Turn off the power, connect the JLink using the RESET signal instead of nTRST, connect the JLink to the PC and turn on the power. At the current stage, U-boot does not bother us at all - wait a minute and try to connect JFlash. The connection must be successful:

2. U-boot.
If you just connect JLink to CortexM7 then the dev board will rebooted due to the auto-reset mode in U-boot. It monitors the loading of the program in CortexA and if it sees hanging (which will appear when JTAG is connected), then in a minute it resets the entire system (this is my understanding of the current situation - maybe it is not quite correct, the developers can correct me). Connecting JTAG does not stop this routine. To stop the auto reset mode, you need to connect to the U-boot port of the terminal (ttyUSB3 / COM port No. 4 on the FTDI4323) during system startup and press any key - this will stop autoload and allow you to work with CortexM7 without resets:

image

3. Connection behavior.
Upon further connection, there may also be messages - “Halting target device failed. Trying again with reset” - which does not affect the operation of the programmer and debugging mode. These messages may appear at the first connection, or not at all.

what do you mean exactly?
That you connect the signal RESET of JLink probe to signal JTAG_1_TRST# on X56 (or X67)?
immagine
And you didi this because the signal JTAG_1_TRST# on the Verdin Development Board is not connected to the TRST pin of iMX8M-Plus but it’s connected to RST?

Yes, you are right.
I connected RESET signal from JLINK to TRST pin on dev board. Because on the SoC TRST is a RESET signal, based on the pin description from Toradex utility.

P.S.: I checked right now the connection with TRST from Studio Code - it also works the same way.

Did you try to stop autoboot from U-boot console?

Thanks.

Do you mean that you tried connecting TRST pin from JLink to JTAG_TRST# signal of X56 (or X67) and it works?

I try to explain what happens to me:

  • I plug JLink to X56 and to my PC. The LED on the JLink is GREEN
  • I open TeraTerm on Cortex-A UART
  • I power on the Verdin Development Board, pressing button ON/OFF
  • all the “power” LEDs on the board become GREEN, but no output from U-Boot on the serial console
  • the LED on JLink becomes RED (this should mean that RESET is pulled low (active) on target side)
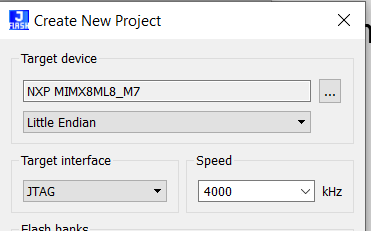
  • I start JFlash with the following parameters

immagine

  • I press Target >> Connect in JFlash
  • I get message Connected successfully and the LED on JLink becomes GREEN again
  • on serial console I see only these messages
U-Boot SPL 2022.04-6.3.0-devel+git.a7d6442796bf (Jan 01 1970 - 00:00:00 +0000)
DDRINFO: start DRAM init
DDRINFO: DRAM rate 4000MTS

and so I imagine that JLink release the RESET (and so the target started its boot), but after some milliseconds the boot of Cortex-A is somehow halted. I don’t understand why.

  • if I press Target >> Disconnect in JFlash, the U-Boot goes on with the other messages, until the full boot of TorizonCore
Training FAILED
DDRINFO: start DRAM init
DDRINFO: DRAM rate 4000MTS
DDRINFO:ddrphy calibration done
DDRINFO: ddrmix config done
DDR configured as single rank
SEC0:  RNG instantiated
Normal Boot
WDT:   Started watchdog@30280000 with servicing (60s timeout)
Trying to boot from BOOTROM
Boot Stage: Primary boot
Find img info 0x&4802d800, size 888
Download 916480, Total size 917024
NOTICE:  BL31: v2.6(release):lf_v2.6-g3c1583ba0a
NOTICE:  BL31: Built : 00:00:00, Jan  1 1970


U-Boot 2022.04-6.3.0-devel+git.a7d6442796bf (Jan 01 1970 - 00:00:00 +0000)

CPU:   i.MX8MP[8] rev1.1 1600 MHz (running at 1200 MHz)
CPU:   Industrial temperature grade (-40C to 105C) at 43C
Reset cause: POR
DRAM:  4 GiB
Core:  89 devices, 23 uclasses, devicetree: separate
WDT:   Started watchdog@30280000 with servicing (60s timeout)
MMC:   FSL_SDHC: 1, FSL_SDHC: 2
Loading Environment from MMC... OK
In:    serial@30880000
Out:   serial@30880000
Err:   serial@30880000
Model: Toradex 0058 Verdin iMX8M Plus Quad 4GB WB IT V1.1A
Serial#: 14777722
Carrier: Toradex Verdin Development Board V1.1B, Serial# 10893470
Net:   eth1: ethernet@30be0000, eth0: ethernet@30bf0000 [PRIME]
Normal Boot
Hit any key to stop autoboot:  0
switch to partitions #0, OK
mmc2(part 0) is current device
Scanning mmc 2:1...
Found U-Boot script /boot.scr
973 bytes read in 1 ms (950.2 KiB/s)
## Executing script at 50280000
6645 bytes read in 1 ms (6.3 MiB/s)
90156 bytes read in 2 ms (43 MiB/s)
118 bytes read in 2 ms (57.6 KiB/s)
Applying Overlay: verdin-imx8mp_hdmi_overlay.dtbo
2219 bytes read in 2 ms (1.1 MiB/s)
Applying Overlay: verdin-imx8mp_dsi-to-hdmi_overlay.dtbo
3165 bytes read in 2 ms (1.5 MiB/s)
Applying Overlay: verdin-imx8mp_spidev_overlay.dtbo
561 bytes read in 2 ms (273.4 KiB/s)
13348705 bytes read in 43 ms (296.1 MiB/s)
11524104 bytes read in 37 ms (297 MiB/s)
   Uncompressing Kernel Image
## Flattened Device Tree blob at 50200000
   Booting using the fdt blob at 0x50200000
   Loading Device Tree to 00000000ffac7000, end 00000000ffb00fff ... OK

Starting kernel ...

[    2.304222] +V3.3_SW: Underflow of regulator enable count
[    2.518816] [drm:drm_bridge_attach] *ERROR* failed to attach bridge /soc@0/bus@32c00000/mipi_dsi@32e60000 to encoder DSI-37: -517
[    2.530612] imx_sec_dsim_drv 32e60000.mipi_dsi: Failed to attach bridge: 32e60000.mipi_dsi
[    2.538965] imx_sec_dsim_drv 32e60000.mipi_dsi: failed to bind sec dsim bridge: -517
[    2.554389] [drm:drm_bridge_attach] *ERROR* failed to attach bridge /soc@0/bus@32c00000/mipi_dsi@32e60000 to encoder DSI-37: -517
[    2.566173] imx_sec_dsim_drv 32e60000.mipi_dsi: Failed to attach bridge: 32e60000.mipi_dsi
[    2.574504] imx_sec_dsim_drv 32e60000.mipi_dsi: failed to bind sec dsim bridge: -517
Starting version 250.5+
[    2.781042] [drm:drm_bridge_attach] *ERROR* failed to attach bridge /soc@0/bus@32c00000/mipi_dsi@32e60000 to encoder DSI-37: -517
[    2.793088] imx_sec_dsim_drv 32e60000.mipi_dsi: Failed to attach bridge: 32e60000.mipi_dsi
[    2.801408] imx_sec_dsim_drv 32e60000.mipi_dsi: failed to bind sec dsim bridge: -517
[    4.786841] [drm:drm_bridge_attach] *ERROR* failed to attach bridge /soc@0/bus@32c00000/mipi_dsi@32e60000 to encoder DSI-37: -517
[    4.799895] imx_sec_dsim_drv 32e60000.mipi_dsi: Failed to attach bridge: 32e60000.mipi_dsi
[    4.808257] imx_sec_dsim_drv 32e60000.mipi_dsi: failed to bind sec dsim bridge: -517
[    4.821277] [drm:drm_bridge_attach] *ERROR* failed to attach bridge /soc@0/bus@32c00000/mipi_dsi@32e60000 to encoder DSI-37: -517
[    4.833117] imx_sec_dsim_drv 32e60000.mipi_dsi: Failed to attach bridge: 32e60000.mipi_dsi
[    4.843030] imx_sec_dsim_drv 32e60000.mipi_dsi: failed to bind sec dsim bridge: -517
[    4.918441] [drm:drm_bridge_attach] *ERROR* failed to attach bridge /soc@0/bus@32c00000/mipi_dsi@32e60000 to encoder DSI-37: -517
[    4.930644] imx_sec_dsim_drv 32e60000.mipi_dsi: Failed to attach bridge: 32e60000.mipi_dsi
[    4.939002] imx_sec_dsim_drv 32e60000.mipi_dsi: failed to bind sec dsim bridge: -517
[    5.852141] [drm:drm_bridge_attach] *ERROR* failed to attach bridge /soc@0/bus@32c00000/mipi_dsi@32e60000 to encoder DSI-37: -517
[    5.863938] imx_sec_dsim_drv 32e60000.mipi_dsi: Failed to attach bridge: 32e60000.mipi_dsi
[    5.872224] imx_sec_dsim_drv 32e60000.mipi_dsi: failed to bind sec dsim bridge: -517
[    6.008451] [drm:drm_bridge_attach] *ERROR* failed to attach bridge /soc@0/bus@32c00000/mipi_dsi@32e60000 to encoder DSI-37: -517
[    6.020759] imx_sec_dsim_drv 32e60000.mipi_dsi: Failed to attach bridge: 32e60000.mipi_dsi
[    6.029112] imx_sec_dsim_drv 32e60000.mipi_dsi: failed to bind sec dsim bridge: -517
[    6.066393] [drm:drm_bridge_attach] *ERROR* failed to attach bridge /soc@0/bus@32c00000/mipi_dsi@32e60000 to encoder DSI-37: -517
[    6.078168] imx_sec_dsim_drv 32e60000.mipi_dsi: Failed to attach bridge: 32e60000.mipi_dsi
[    6.086558] imx_sec_dsim_drv 32e60000.mipi_dsi: failed to bind sec dsim bridge: -517
[    6.230347] [drm:drm_bridge_attach] *ERROR* failed to attach bridge /soc@0/bus@32c00000/mipi_dsi@32e60000 to encoder DSI-37: -517
[    6.242129] imx_sec_dsim_drv 32e60000.mipi_dsi: Failed to attach bridge: 32e60000.mipi_dsi
[    6.250445] imx_sec_dsim_drv 32e60000.mipi_dsi: failed to bind sec dsim bridge: -517
[    6.308406] [drm:drm_bridge_attach] *ERROR* failed to attach bridge /soc@0/bus@32c00000/mipi_dsi@32e60000 to encoder DSI-37: -517
[    6.320245] imx_sec_dsim_drv 32e60000.mipi_dsi: Failed to attach bridge: 32e60000.mipi_dsi
[    6.328612] imx_sec_dsim_drv 32e60000.mipi_dsi: failed to bind sec dsim bridge: -517
[    6.367639] fsl-aud2htx 30cb0000.aud2htx: failed to pcm register
[    6.376020] [drm:drm_bridge_attach] *ERROR* failed to attach bridge /soc@0/bus@32c00000/mipi_dsi@32e60000 to encoder DSI-37: -517
[    6.387822] imx_sec_dsim_drv 32e60000.mipi_dsi: Failed to attach bridge: 32e60000.mipi_dsi
[    6.396311] imx_sec_dsim_drv 32e60000.mipi_dsi: failed to bind sec dsim bridge: -517
[    6.436449] fsl-aud2htx 30cb0000.aud2htx: failed to pcm register
[    6.686075] fsl-aud2htx 30cb0000.aud2htx: failed to pcm register
[    6.747093] fsl-aud2htx 30cb0000.aud2htx: failed to pcm register
[    6.846250] imx-hdmi sound-hdmi: snd_soc_register_card failed (-517)

TorizonCore 6.3.0-devel-202305+build.7 verdin-imx8mp-14777722 ttymxc2

verdin-imx8mp-14777722 login:

@Stan88 is this the same situation that you see?

In this way, a consistent way to have JTAG working on Cortex-M is:

  1. plug JLink to X56 and to development PC. The LED on the JLink is GREEN
  2. open TeraTerm on Cortex-A UART
  3. power on the Verdin Development Board, pressing button ON/OFF. The LED on JLink becomes RED
  4. start JFlash and select Target >> Connect
  5. from JFlash select Target >> Disconnect
  6. from serial console, press any key to stop the boot process in U-Boot

It’s quite a long list, but at leat in this way the JTAG interface on Cortex-M works (download firmware, debug, …).

I haven’t found any way to have the JTAG working when Cortex-A is running TorizonCore.

Hi @vix
I’m not sure that this is possible without stopping CortexA53 during U-boot loading. (I don’t need to debug firmware for CortexM7 while CortexA53 is running - so I didn’t get into this in more detail).

@Stan88 , @hfranco.tx
do you know if TorizonCore (or Linux in general) disables JTAG pins when it runs on Cortex-A?
This could be the reason why the JTAG cannot work as expected when Cortex-A runs TorizonCore.