fdortu
March 28, 2023, 12:51pm
1
Hello,
I use two ways for debugging C/C++ in VSCode / Torizon, either using gdbserver or valgrind as follows
application.targetfiles: ENTRYPOINT stdbuf -oL -eL gdbserver 0.0.0.0:6502 /#%application.appname%#/#%application.exename%# #%application.appargs%#'`
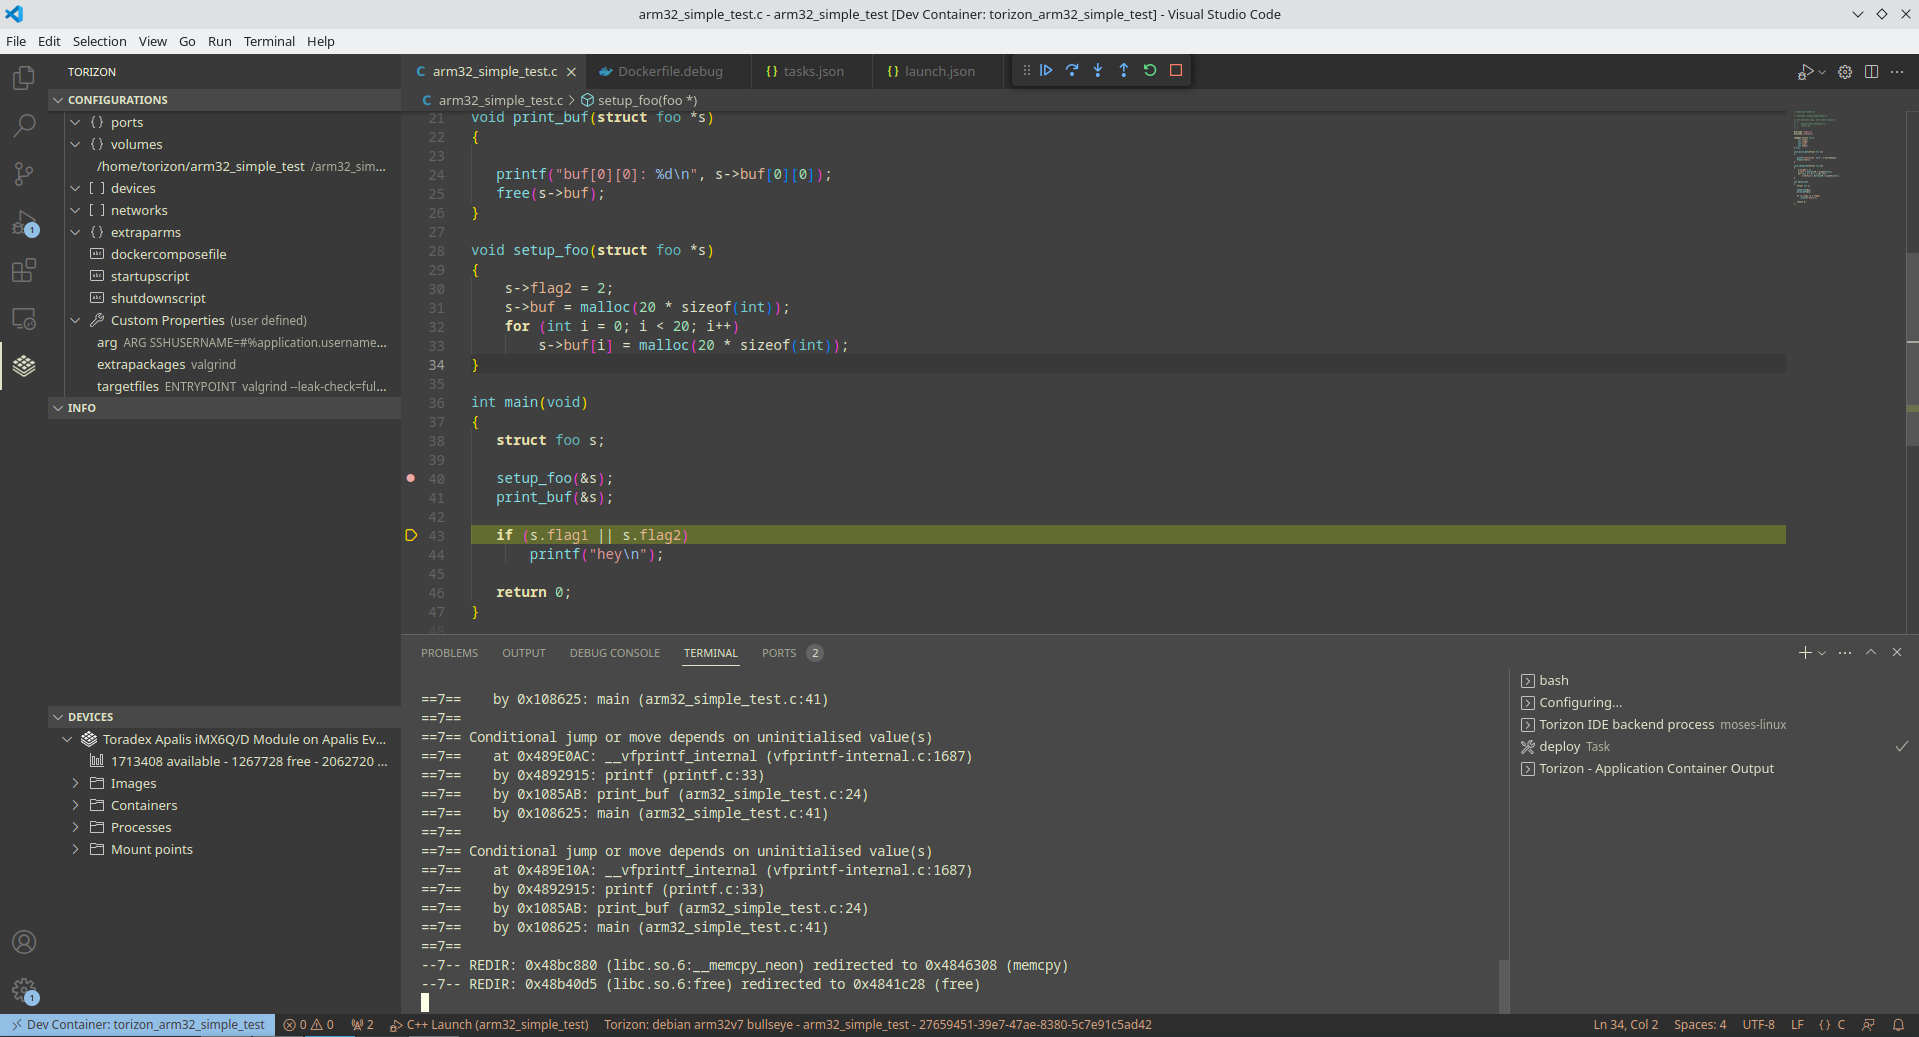
application.targetfiles: ENTRYPOINT valgrind --leak-check=full --show-reachable=yes --error-limit=no --suppressions=/home/torizon/minimal.supp -v /#%application.appname%#/#%application.exename%# #%application.appargs%#
Is there a way to combine both valgrind and gdb ?
Best regards,
Hi @fdortu ,
Is there a way to combine both valgrind and gdb ?
I did some research and you can use both of them by using vgdb, which is already included in the valgrind package from the Debian feeds.
vgdb should be executed soon after starting valgrind, passing the port being used. For instance, your application.tagetfiles configuration could be similar to this:
ENTRYPOINT valgrind --leak-check=full --show-reachable=yes --error-limit=no -v /#%application.appname%#/#%application.exename%# #%application.appargs%# & sleep 2; vgdb --port=6502
With the config above I was able to run a debug session with a C test program while running Valgrind.
I’ve used these references:
See if this works for you.
Best regards,
Hello @fdortu ,
Were you able to solve your issue with the info provided by @lucas_a.tx ?
Best regards,