I would like to get your feedback on a CPU overheating problem we are facing on our machine using the Colibri T30 v1.1E with a kernel based on Colibri_T30_LinuxImageV2.5Beta2_20151106.
Our GUI application is made of video screens and simple screens (i.e. sequence of screens playing videos using GPU vs. basic Qt widgets display). On average, we have a CPU usage of around 25%.
We have seen some Colibris suddenly crash afer running the application for some hours (some fail just after 2 hours). After more investigations, we could identify that the crash was due to overheating of the Colibri (internal temperature > 85°C).
We have run some more tests on various Colibris and could find that some would always fail where some others would run for a long time without any issues (CPU temperature remains stable around 60-65°C).
We could also link the overheating of failing CPUs to the playing of videos. Here is the result of our investigations:
Continuous video playing (H.264, 640x354, 30fps) using GPU on 11 colibris (see chart attached)
2 reached a CPU temperature of 85°C in less than 2h and crashed
1 reached a CPU temperature of 85°C in 2.5h and crashed
3 reached a CPU temperature of > 75°C in 2h which kept increasing slowly
5 remained at an internal CPU temperature of less than 70°C for more than 8h
Running the same application with video playback enabled/disabled on an overheating Colibri:
when video playback is enabled, the Colibri temperature keeps increasing
when video playback is disabled, the Colibri temperature remains stable at around 55°C
What we see from those tests is that different Colibris behave very differently under the same conditions. Finally, this does not seem to be linked to some batch of Colibri but spread accross the various ones we have.
We have read your report on Thermal Testing the T30 and your tests are much more extreme in terms of CPU/GPU usage than what we do in our application. Although I agree that using a heatsink would help, I would not expect the Colibri to reach such temperatures with this average CPU load.
Have you heard of such issue in the past? Could this be linked to GPU? I would greatly appreciate your feedback on this issue.
Please note that NVIDIA’s chips are known to show quite a wide range of speed/voltage and with that power consumption and thermal variance. Of course all within specs which NVIDIA calls Speedo and it would be interesting trying to match those numbers with your chart as given above. One of my random modules e.g. reports the following upon boot:
[    0.000000] Tegra3: CPU Speedo ID 2, Soc Speedo ID 2
[    0.000000] Tegra Revision: A03 SKU: 0xb0 CPU Process: 2 Core Process: 0
Does this happen running our stock BSP demo image as well? Or could you at least make sure CPU hot-plugging is properly working in your configuration (e.g. by looking at the tegrastats output)?
Please also note that anything before V2.6 is really no longer supported by us so we suggest updating to our stable V2.6 BSP or at your discretion our latest V2.7 beta 1 BSP.
Thanks for the answer, I had a look at the different points you mentioned and could find a first correlation between failing modules and their IDs/Process.
I did check the CPU/SoCSpeedo IDs, Tegra revision and CPU/core Process of all our modules and I could relate the non-working and bad behaving modules to modules with a CPU Process=3.
Modules with a CPU Process =1 or 2 behave correctly and pass our 8 hours stress test without any issue. With modules with a CPU Process: 3 we observe that some reach 85°C very quickly and stop while some others stay below 85°C but stabilize a much higher temperatures (77 to 82°C) that those with a CPU Process:1 or 2 which stay between 65 and 70°C.
On other characterization parameters all our modules have the same values, namely:
CPU Speedo ID: 2
SoC Speedo ID: 2
Tegra Revision: A03
SKU: 0xb1
Core Process: 0
Can you elaborate a bit on this CPU Process value, what it means and how it is generated/computed? I had a look at the Kernel sources and Tegra3TRM but could not grasp the real meaning of this rating.
Does this happen running our stock BSP
demo image as well? Or could you at
least make sure CPU hot-plugging is
properly working in your configuration
Check has not been done with a stock Toradex BSP and eval board. I will pickup a faulty Colibri and try to reproduce the problem with your official BSP.
(e.g. by looking at the tegrastats output)?
What exactly should be observed in tegrastats output ? Output is cryptic and I could not find any clear documentation. I know I have at least CONFIG_TEGRA_AUTO_HOTPLUG=y and CONFIG_HOTPLUG_CPU=y enabled in my kernel config.
I don’t think there is any bad thermal behaviour per se as they all behave as per their specification. But of course some draw a little more power then others and may therefore dissipate a little bit more heat.
Can you elaborate a bit on this CPU Process value, what it means and how it is generated/computed? I had a look at the Kernel sources and Tegra3TRM but could not grasp the real meaning of this rating.
Unfortunately apart from NVIDIA’s datasheet and TRM we do not really have any further information on this topic.
What exactly should be observed in tegrastats output ? Output is cryptic and I could not find any clear documentation.
Basically in idle it should show you in square brackets a rather low utilisation of the first plus all off for the second, third and fourth core. And after the at sign after the square bracket it shows the current frequency the core(s) are running at e.g. as follows:
I guess by good or bad you mean a specific behaviour in your environment under your workload. However we expect all this modules do perform according to NVIDIA’s specification and suspect that either your environment is outside the specification or your particular workload is. This may require optimisations on the thermal design or tuning of the software side.
We faced a new case of overheating issue with a Colibri IT V1.1A. The rest of the environement / BSP remains the same (see initial post).
In that case, the temperature of the Colibri (in operation, i.e. playing videos from time to time) was stable around 50 to 60°C and after 1h30min, when starting playing another video (same format as all others), the temperature rose suddenly very quickly (in about 8 min) to reach the 85°C and protective shutdown.
What’s interesting is that we could correlate this timing with this Gstreamer log:
1:33:54.819741000 omx /dvs/git/dirty/git-master_linux/external/gstreamer/gst-openmax/omx/gstomx_util.c:947:wait_for_state:[00m timed out switching from ‘executing’ to ‘idle’
1:33:54.820080000 omx /dvs/git/dirty/git-master_linux/external/gstreamer/gst-openmax/omx/gstomx_util.c:956:wait_for_state:[00m wrong state received: state=3, expected=2
My feeling is that the GPU got stuck active in some weird state and this activity makes the chip temperature increase.
I am contacting you as I need your help to try identify where the issue comes from (Gstreatmer itself, Nvidia driver, …)?
We faced a new case of overheating issue with a Colibri IT V1.1A. The rest of the environement / BSP remains the same (see initial post).
What particular BSP version are you now talking about?
In that case, the temperature of the Colibri (in operation, i.e. playing videos from time to time) was stable around 50 to 60°C and after 1h30min, when starting playing another video (same format as all others), the temperature rose suddenly very quickly (in about 8 min) to reach the 85°C and protective shutdown.
What’s interesting is that we could correlate this timing with this Gstreamer log: 1:33:54.819741000 omx /dvs/git/dirty/git-master_linux/external/gstreamer/gst-openmax/omx/gstomx_util.c:947:wait_for_state:[00m timed out switching from ‘executing’ to ‘idle’ 1:33:54.820080000 omx /dvs/git/dirty/git-master_linux/external/gstreamer/gst-openmax/omx/gstomx_util.c:956:wait_for_state:[00m wrong state received: state=3, expected=2
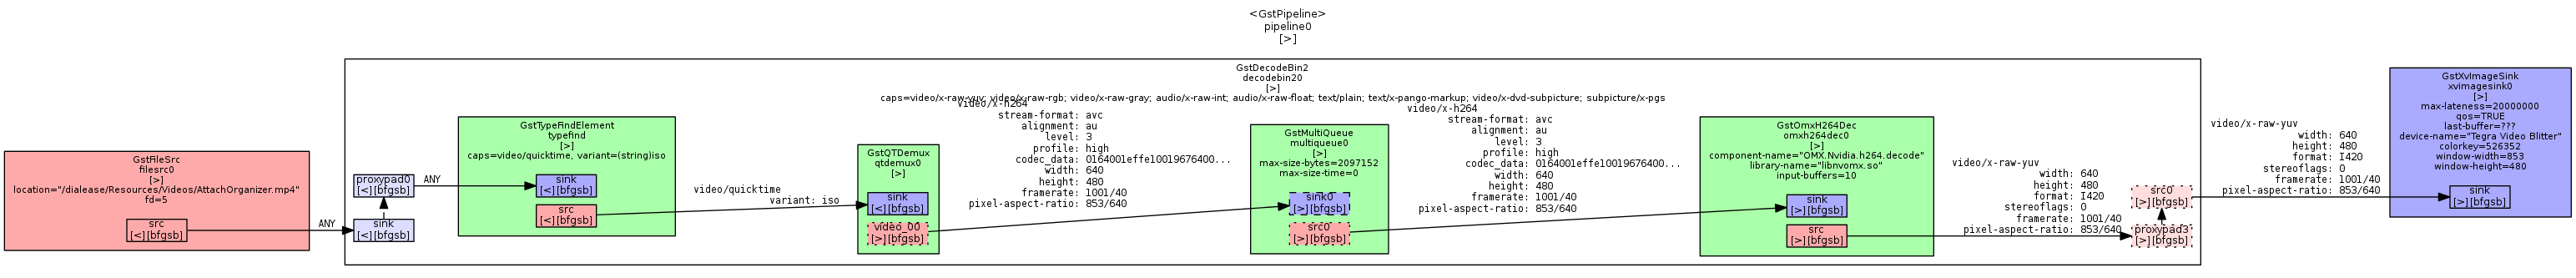
I do not recall ever having heard of any similar issue before. Was this a one time only occurrence or are you able to reproduce this bad behaviour? Could you share the exact gstreamer pipeline which provoked the issue?
My feeling is that the GPU got stuck active in some weird state and this activity makes the chip temperature increase.
Yes, sounds like it.
I am contacting you as I need your help to try identify where the issue comes from (Gstreatmer itself, Nvidia driver, …)?
Yes, makes sense. I guess as a first step we need to understand exactly what versions of things and which configuration you are talking about.
Our linux is based on Colibri_T30_LinuxImageV2.6Beta2_20160701.
Our version of Gstreamer is 0.10.36
Our version of Linux for Tegra (codecs) is R16.5.
It looks like you are already using the latest stable versions then.
We only observed the issue once on V1.1A.
If the issue can’t easily be reproduced I guess it will be rather hard to investigate it much further. That said our hardware design should protect the T30 SoC from overheating so in the worst case it should at least reset the board to get out of such a failure condition.